An In-Depth Guide to Using Google Analytics 4 (GA4)
On July 1, 2023, Universal Analytics properties will stop processing new hits, followed by Universal Analytics 360 properties will stop new hit processing on October 1, 2023.
According to Google, current approaches aren’t keeping pace with significant shifts in consumer behaviour and privacy-driven changes. It’s difficult to derive valuable insights from consumers’ data and understand them well. That’s why Google built a smarter version of Google Analytics 3 (a.k.a Universal Analytics) on the foundation of its App + Web property called Google Analytics 4.
Google Analytics 4 (GA4) comes with machine learning that automatically fetches helpful insights, giving you a complete picture of your customers across various platforms and devices. In other words, GA4 reveals who’s visiting your site or app, how they’re searching it, and what they’re doing there.
GA4 has a privacy-centric design to help you rely on Analytics even when industry changes like cookie restrictions occur.
However, there’s a learning curve.
With enhanced measurement features, predictive analytics, and new report functions, it’s natural to wonder how to get started and where to go from there. If you want to know the same, you’ve landed in the right place.
In this comprehensive Google Analytics 4 guide, you’ll learn everything you need to get started and improve your websites and mobile apps.
Let’s see what Google Analytics 4 has in store for you.
What is Google Analytics 4?
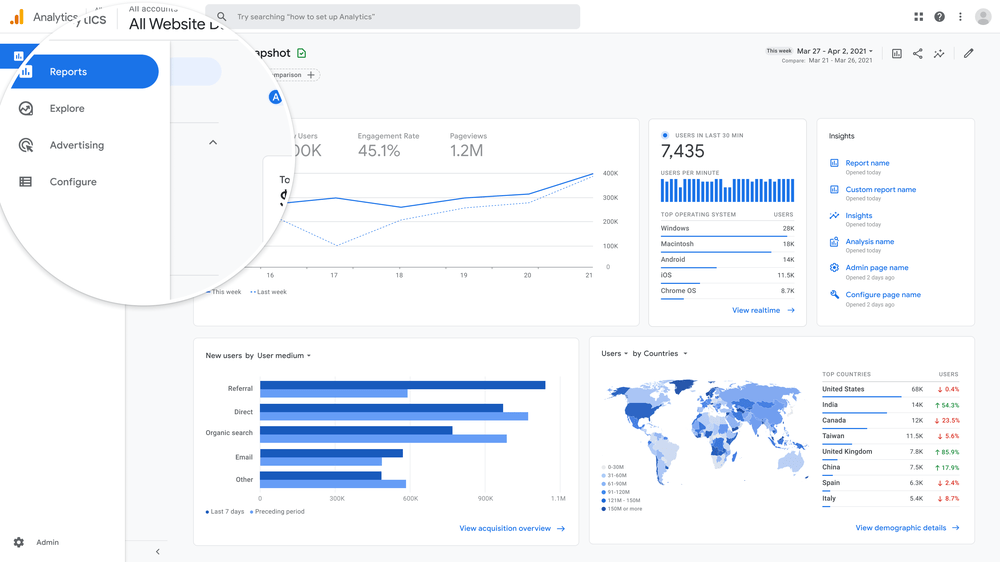
Google Analytics 4 (formerly known as App + Web) is the newest version of Google Analytics. Since it’s the fourth version, it is also called GA4. It lets you track a customer’s journey on your website and App in the same account. It comes with various new reporting features, giving you detailed insights into how visitors interact with your website or App.
Previously, you needed Google Analytics property to measure website usage data, and for mobile app usage data, you needed Google Analytics for Firebase or Google Analytics App view. Google Analytics 4 brings it all together in one place, along with new ways to measure and analyse traffic usage.
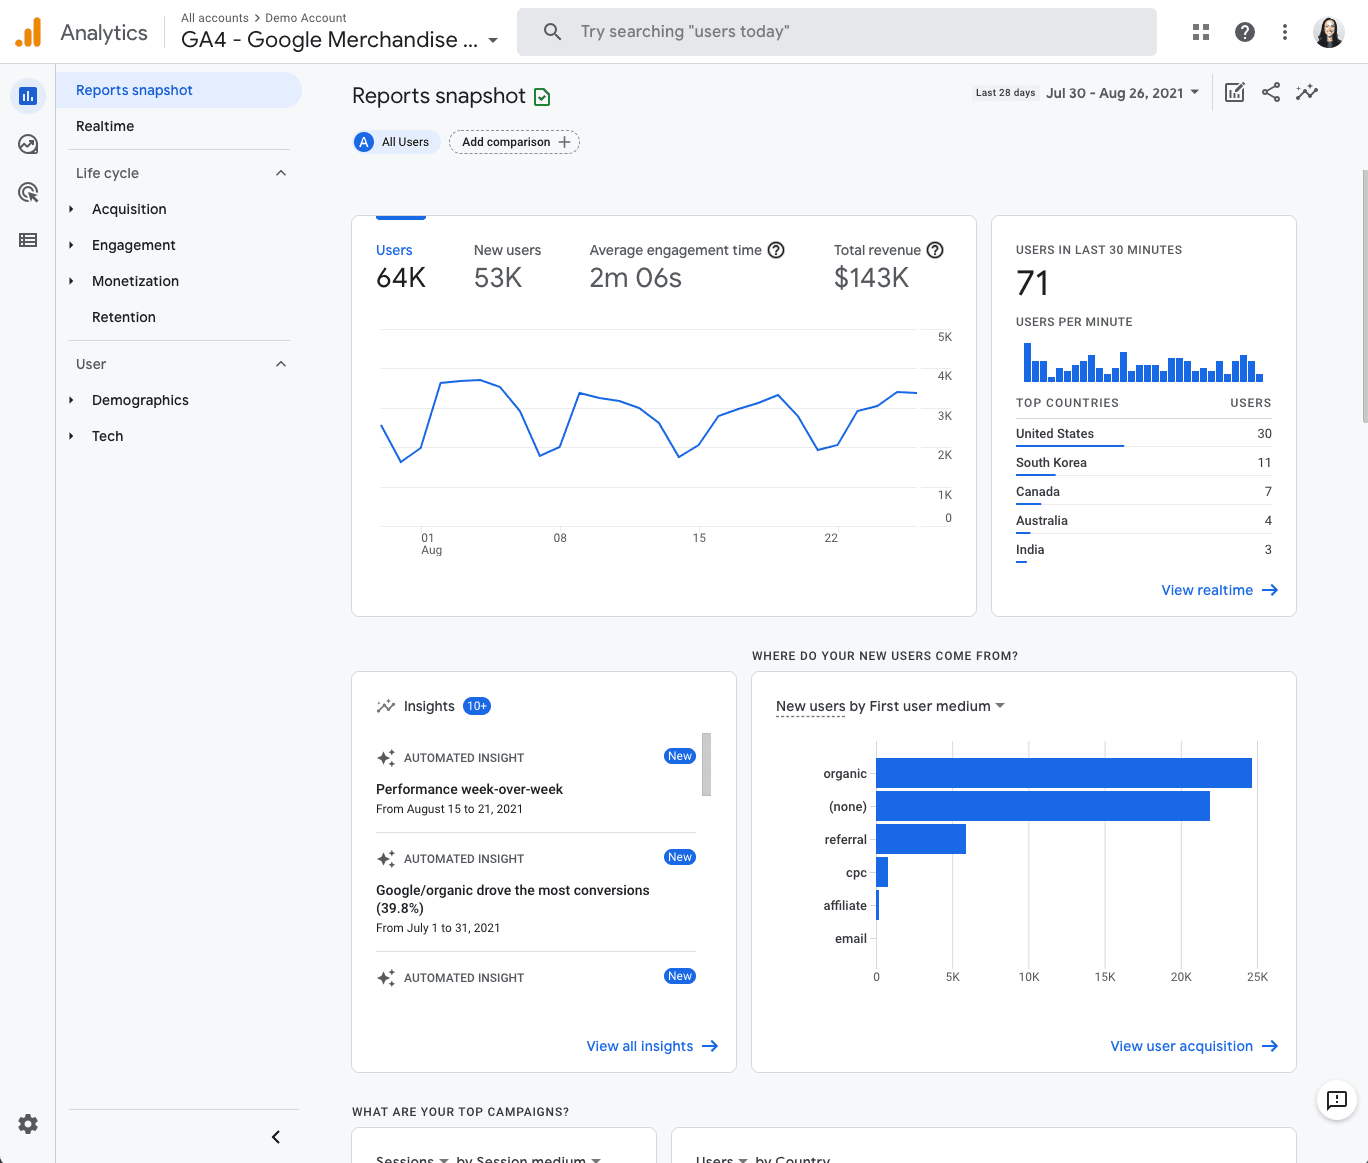
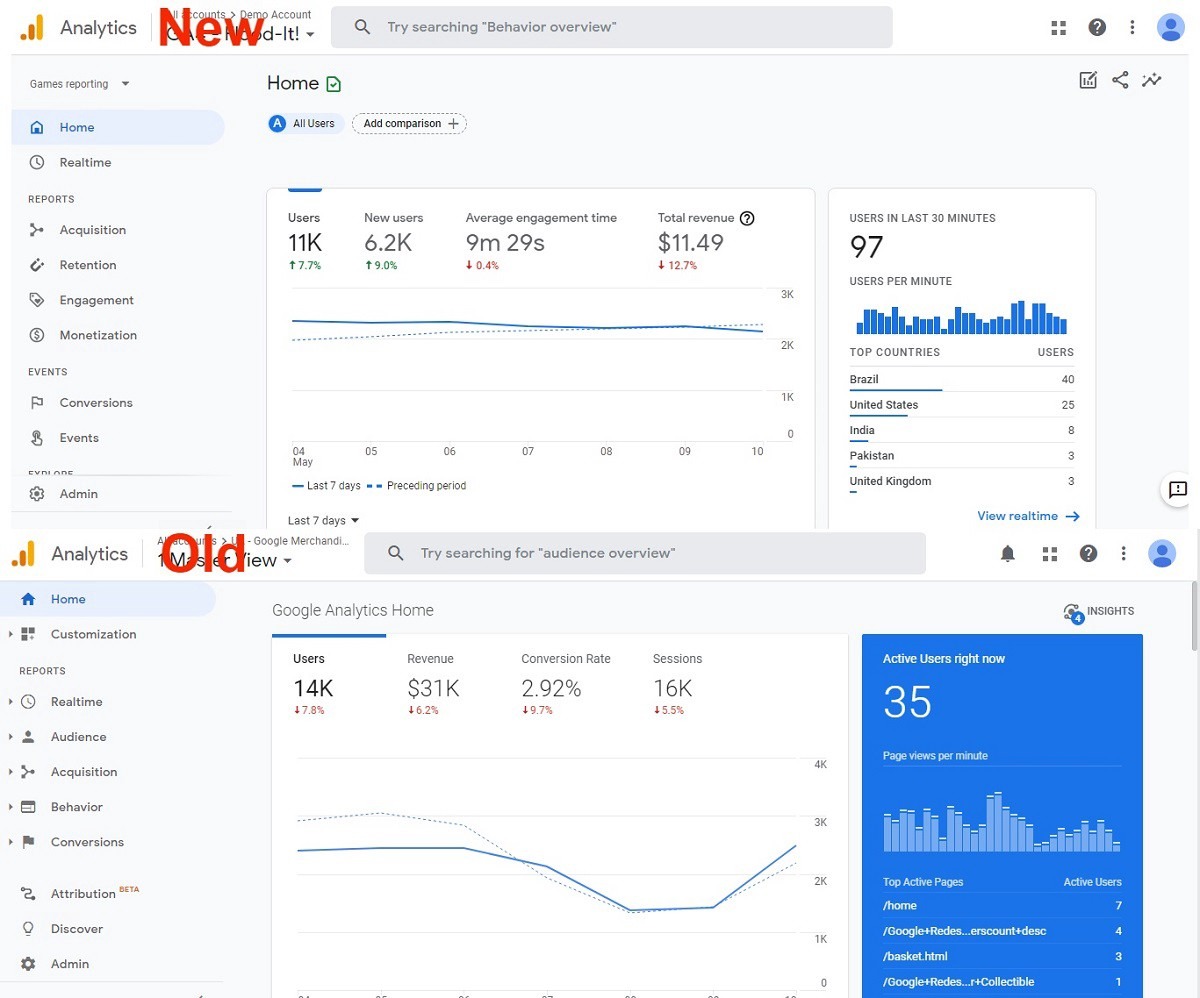
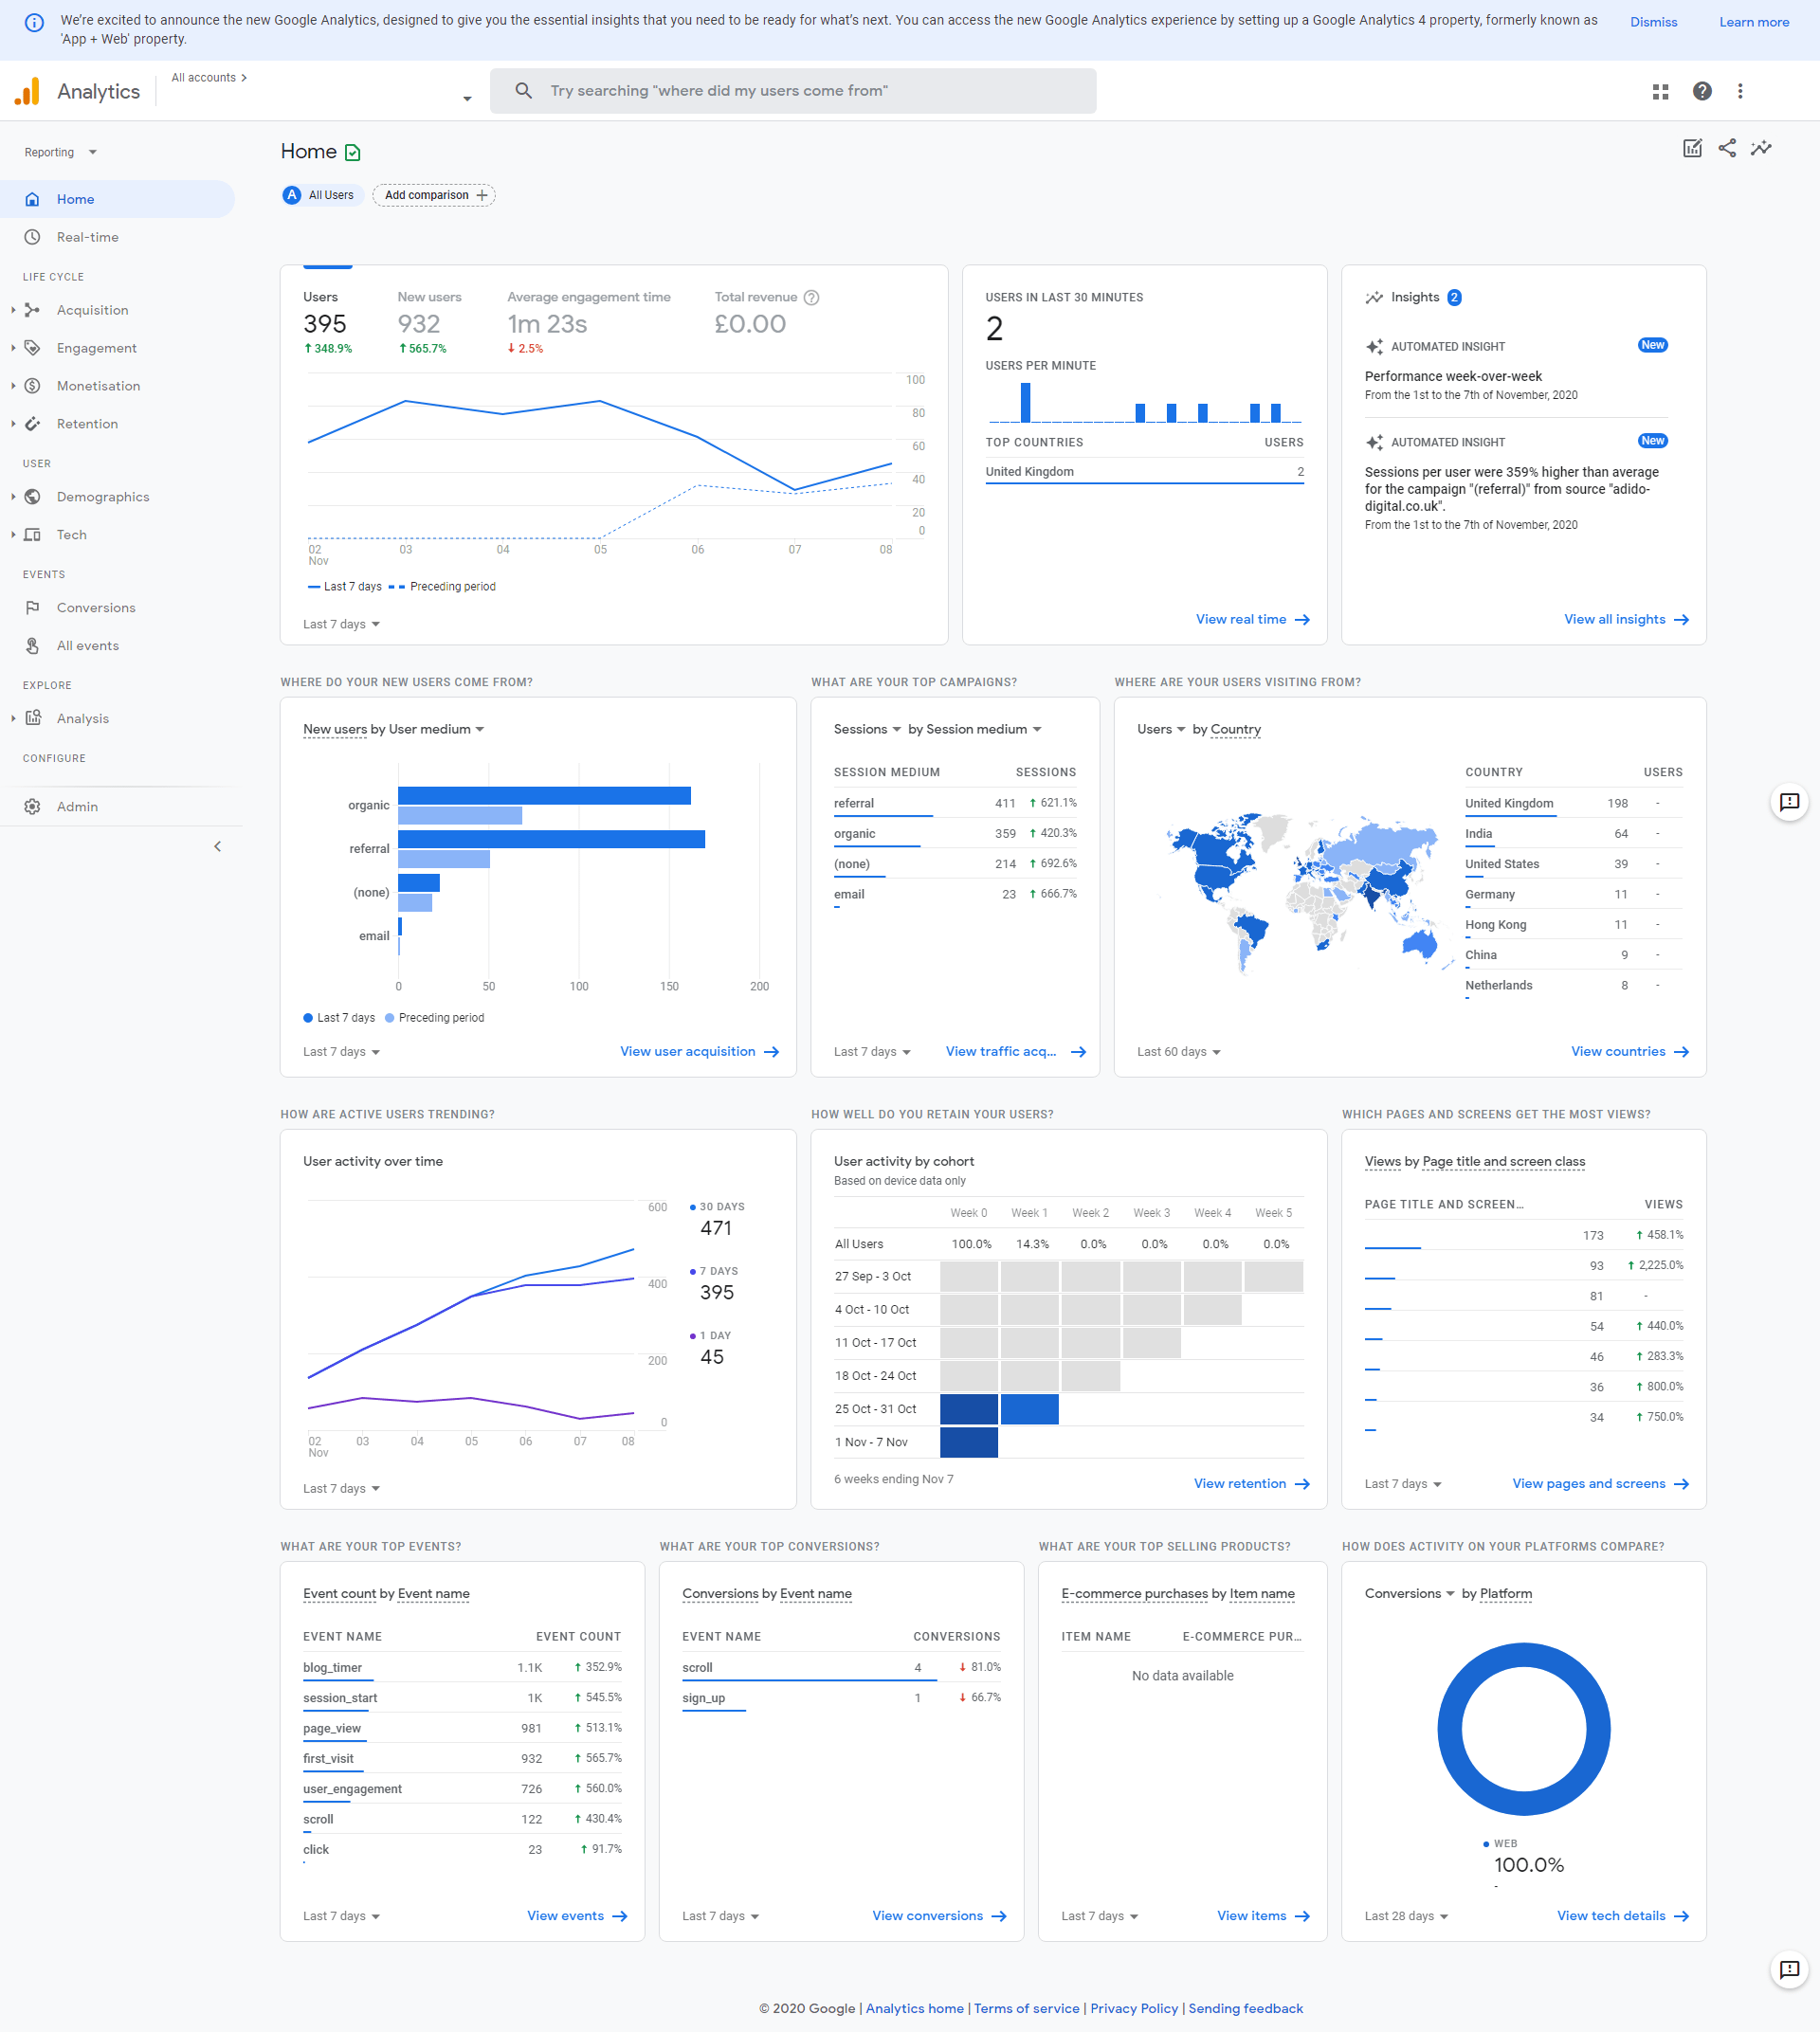
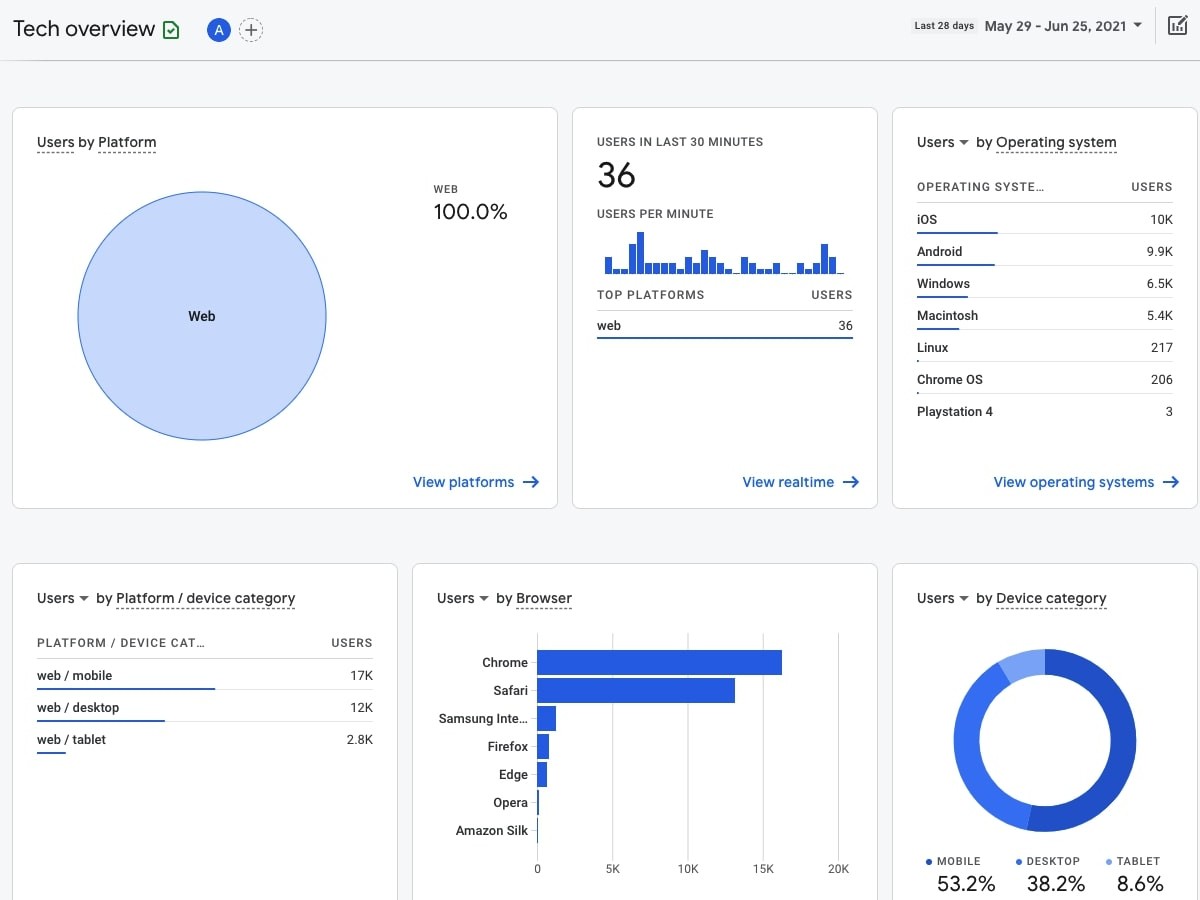
Here’s what it looks like:
GA4 recognises and analyses data to help you learn:
- Where are your visitors coming from?
- What do they want?
- Which touchpoints convert them into customers?
- What are your highest profitable traffic sources?
- Which marketing campaigns attract the maximum visitors?
You can use this data to optimise your marketing strategies and turn prospects into repeat customers.
Should You Switch to Google Analytics 4?
Since Google has decided to sunset Universal Analytics (the current version of GA) in July 2023, should you transition to Google Analytics 4 or not? is not a question anymore. Rather, it’s a necessity.
You would not be able to port over data from the older GA version to the new GA4. That’s why you need to migrate sooner rather than later so that you have some historical data to work on in the new platform. According to a poll, 70% of the 250 marketers are planning to switch to Google Analytics 4. So if you haven’t started using GA4, now is the time. The more familiar you become with GA4’s interface and capacities, the better-armed you’ll be to manage the migration for your brand.
Google Analytics 4 vs Google Analytics (Universal Analytics)
You’ll notice many changes in looks and navigation when you explore Google Analytics 4. Also, Google is continuously working on adding more functionality.
As of now, here are some major differences between Google Analytics 4 and Universal Analytics:
1. GA4 focuses on events instead of sessions
The biggest difference between GA4 and Universal Analytics is how data is collected. Universal Analytics relied on a “session-based model” to track data. It grouped user interactions like pageviews and transactions in a given time frame.
Google Analytics 4 uses “event-based tracking” to collect data. An event-based model processes each user’s interaction as a standalone event. Let’s say, in GA4, a “page view” is considered an event. So if you are tracking a “pageview” event, this will show you the users’ page location, page title, etc.
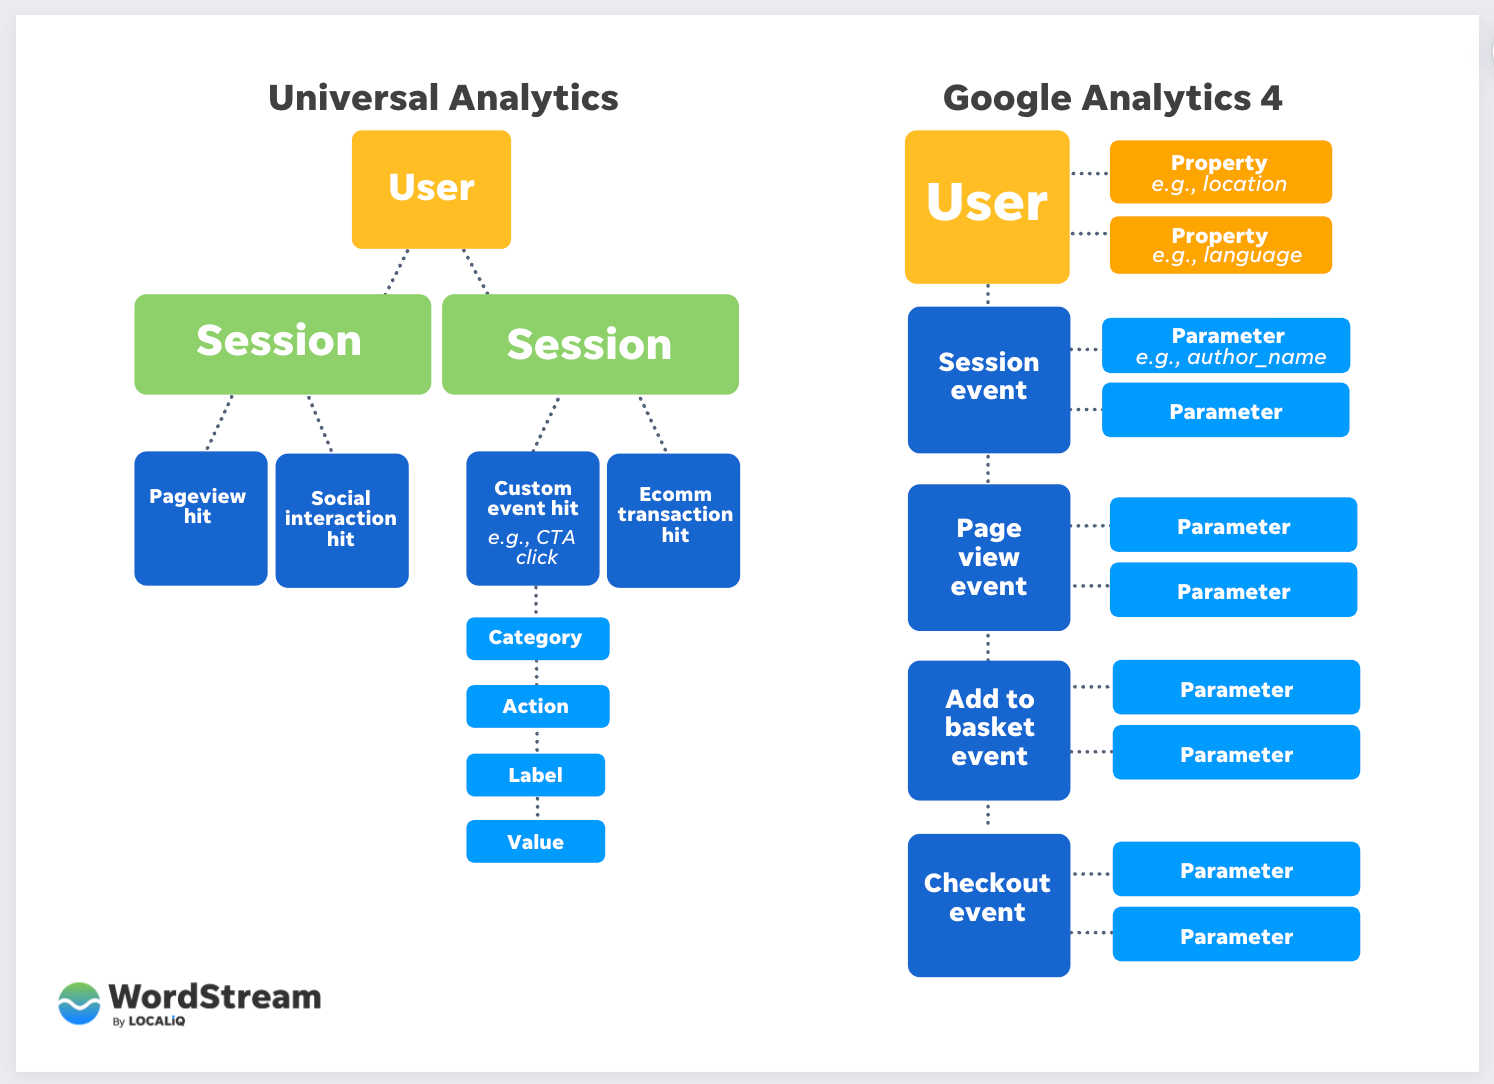
Source: Wordstream.com
The event-based model makes GA4 more flexible and precise in predicting user behaviour. Each event tracking offers more granular and accurate data. You’ll receive detailed information on how users interact with your website or app.
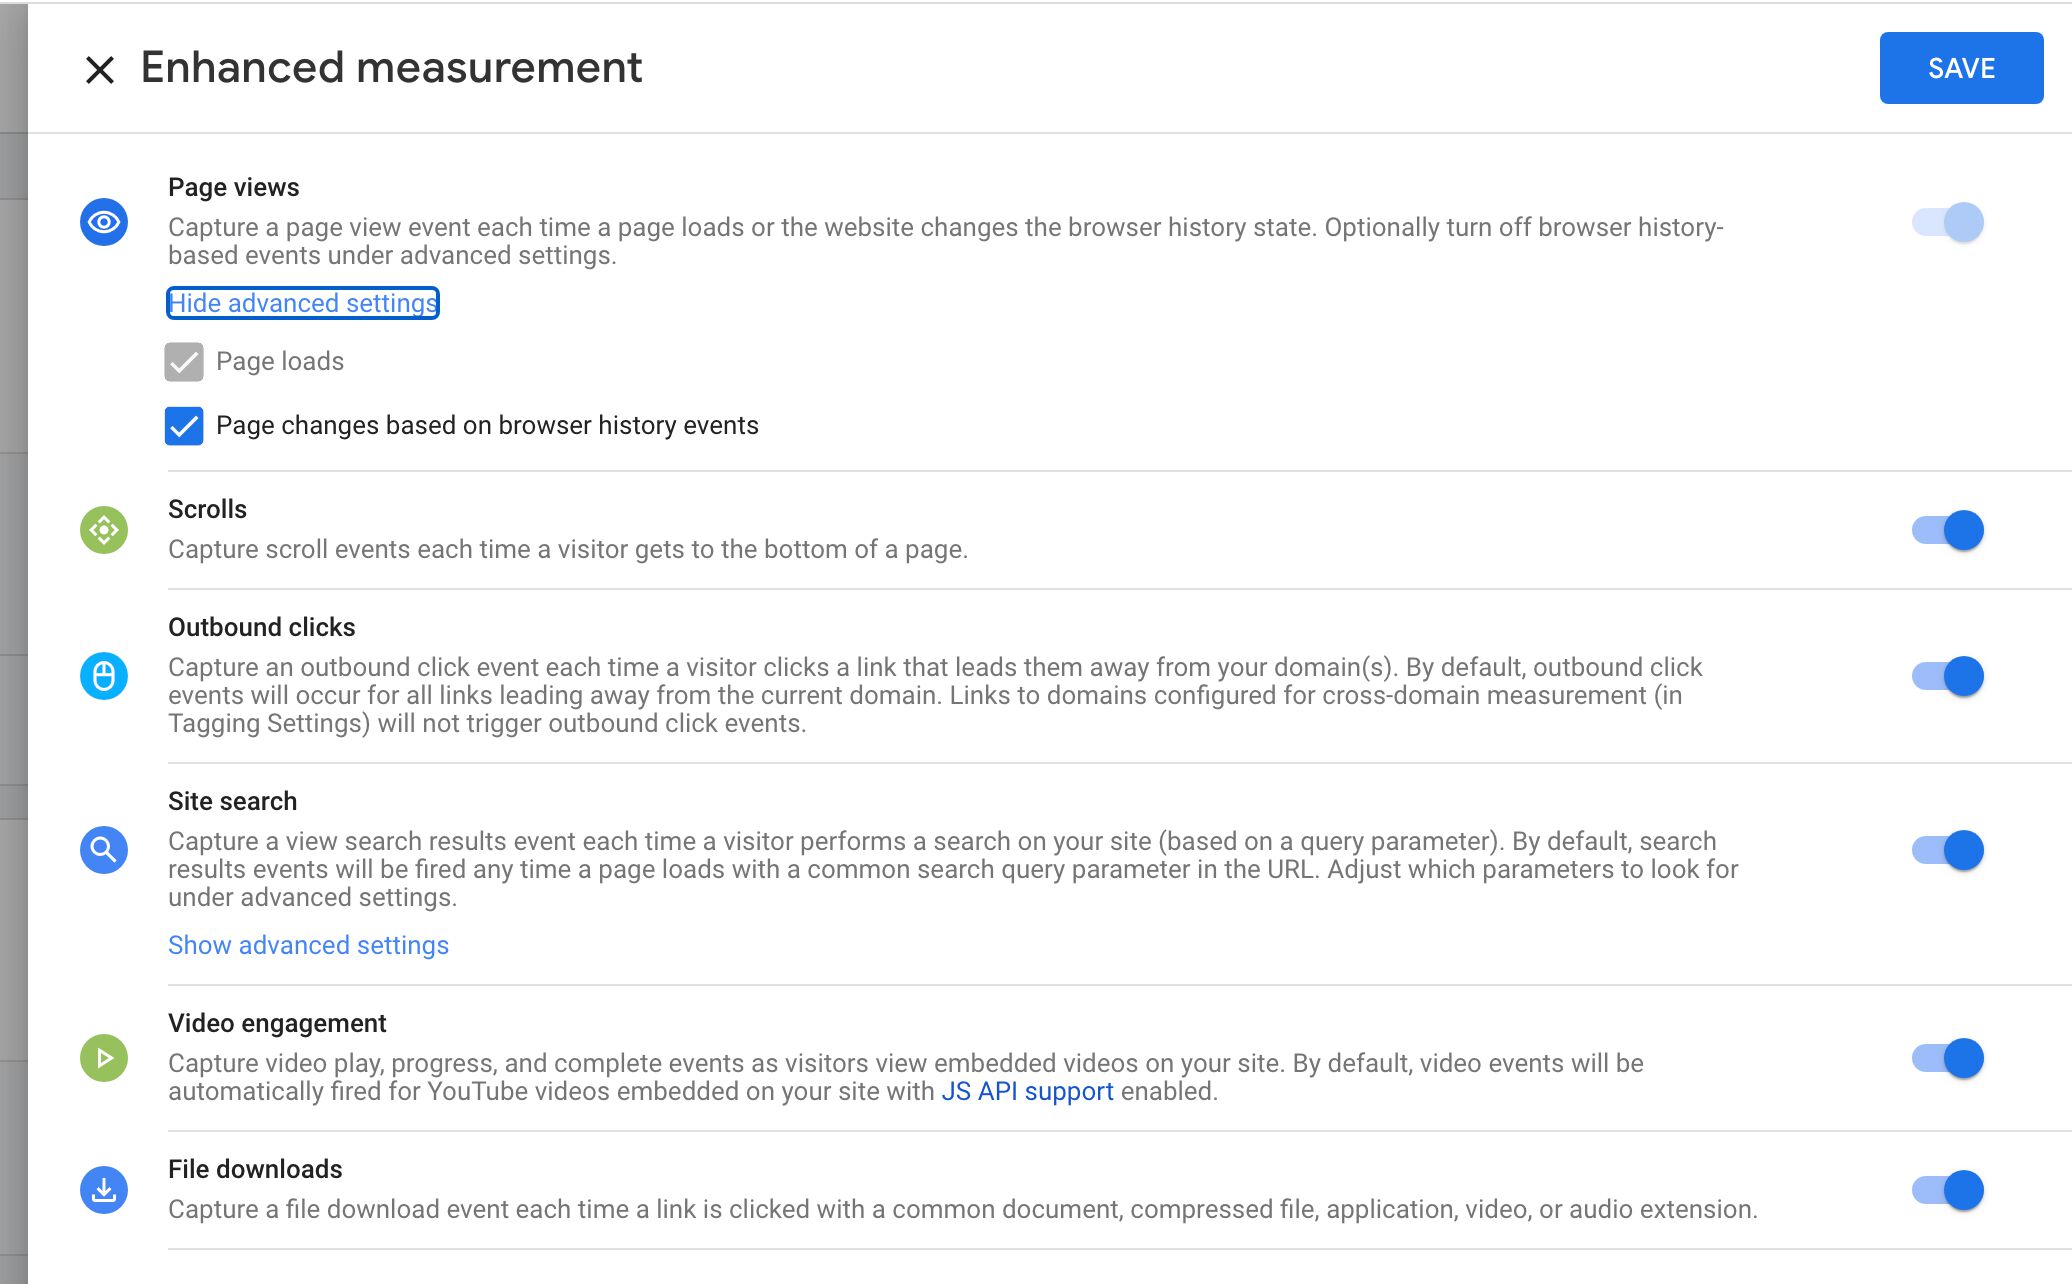
Besides, GA4 automatically collects data on outbound clicks, scrolling, file downloads, and video engagement. It’ll also track some events without any website code changes. Whereas, with Universal Analytics, you need to set additional tags and triggers to access this kind of data.
2. The reporting interface is organized as per customer lifecycle stages
On your first visit, you’ll notice some reports, once available on Universal Analytics, are missing from Google Analytics 4. That’s because GA4 will generate many reports once you start tracking events.

Get weekly insights for revenue-shifting results
Sign up for our newsletter and be the first one to know about our exclusive offers, digital marketing news and updates.
|
|
Thank you for Signing Up |


Next, Universal Analytics has five types of reports, while GA4 has four reports organised around customer lifecycle stages: Acquisition, Retention, Engagement, and Monetisation.
Another difference is that instead of bombarding you with a long list of reports, GA4 gives you an overview of reports as summary cards, making it easier to navigate and understand data at first glance.
In GA4, you can create custom dashboards and reports suited best to your needs.
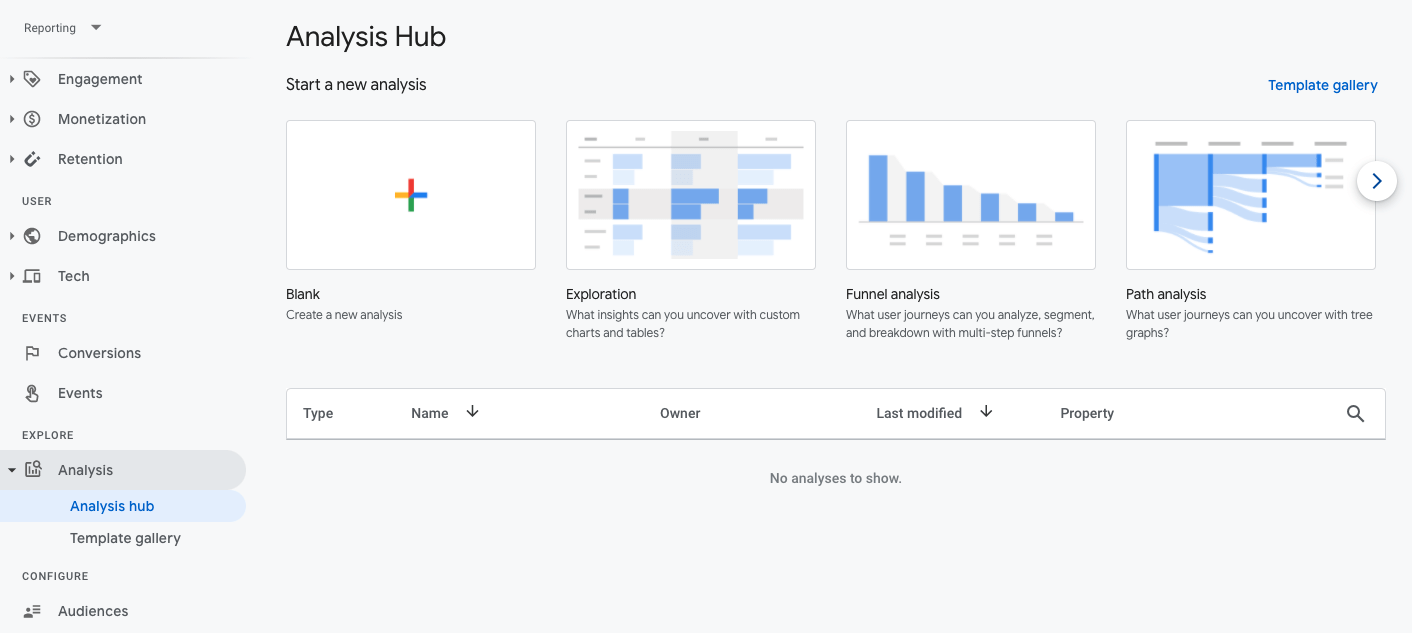
Further, Google Analytics 4 is furnished with a new “Explore” interface that includes upgraded analysis systems like Funnel exploration, Segment overlap, User exploration, etc.
Suffice to say that the new GA4 analysis hub helps you explore in-depth data and get answers to complicated questions.
3. GA4 uses predictive analytics instead of third-party cookies
“Users are demanding more privacy, transparency, choice, and control over how their data is collected and used,” says Justin Schuh, Google’s Director of Chrome Engineering. He also implied that Google is evolving to create the web ecosystem to meet such demands, and GA4 is the result of such evolution.
Although Universal Analytics provides various privacy features, GA4 comes with privacy at its core. GA4 does not store IP addresses and third-party cookies. Instead, it relies on machine learning to forecast future outcomes with the help of current and historical data.
You can also remove specific data like data from ad personalization. This feature helps businesses meet users’ evolving expectations while having granular control over data.
For newbies: Third-party cookies are placed on a website by someone other than the website owner to collect user data and remember users’ information for later use.
4. Bounce rate is replaced with engaging sessions
Universal Analytics’ bounce rate tells you the percentage of website visitors leaving without taking action, like filling out a form, clicking on a link, or making a purchase. While this data worked for a reasonable amount of time, you still can’t dig deeper into why visitors may have left. The bounce rate tells you the problem, not the solution. The issue can be hiding behind valueless content or broken links. You don’t know for sure.
Google Analytics 4 replaced the bounce rate with a new metric called “Engaged sessions”—an inversion of the bounce rate. It measures active user interactions rather than a lack of them.
Engaged sessions are recorded when:
✔ Users stay longer than 10 seconds on your site
✔ View one or more pages, or trigger an action like signing up for an email newsletter
✔ Or follow you on social media
As a result, you get a complete understanding of customer experience and optimise your marketing budget as well as strategies.
Engaged sessions also tell you if your visitors interact with each page the same way you want. Hence, it gives you a bigger picture of what users are looking for. You can find engagement rate, engaging sessions, and engagement times in the same section of GA4 where the bounce rate used to live.
With all said and done, Google Analytics 4 is more powerful and user-friendly than Universal Analytics.
Now let’s look at the advantages and disadvantages of Google Analytics 4.
Pros and Cons of Google Analytics 4
Google Analytics 4 is designed with your goals in mind, such as generating leads, driving sales, or increasing app installs.
Here are a few benefits of Google Analytics 4 that can support your business:
Understand your customers across multiple touchpoints
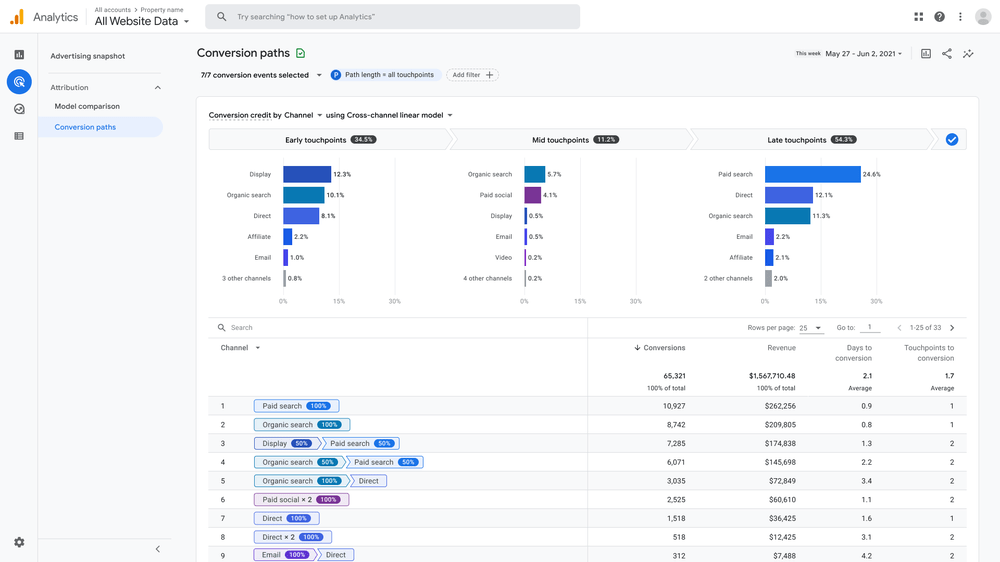
GA4’s event-based tracking allows data collection from various devices and touchpoints (both online and offline). Together, it brings your customers into one view. For instance, you can see which channels initiated, assisted, and closed conversions.
You can also see the path users took to reach the conversions along with the following metrics:
- Purchase revenue
- Touchpoints to conversion (early, mid, and late touchpoints)
- Days to conversion
All these reports help you understand where your customers are, what persuaded them towards conversions, areas resisting potential customers from making purchases, and how you can make it easier for them to reach conversions.
Cross-platform tracking
Google Analytics 4 assigns a unique ID to each user. This User ID tells you about the different devices prospects use to interact with your website or app.
For instance, if a user leaves your website on a desktop and continues exploring it on mobile, GA4 reports will connect this user’s data to their unique ID to show you their journey from desktop to mobile.
Since Google Analytics 4 tracks both web and app data in one place, it lets you see the entire customer journey, from beginning to end and from platform to platform.
It’s incredibly useful information for businesses or marketers as it helps you understand users’ cross-platform experience. You can use this data to build accurate customer models for different devices or platforms.
Boost ROI with data-driven attribution
Data-driven attribution uses machine learning algorithms to analyse both converting and non-converting paths. It incorporates data such as device type, the order of ad exposure, the number of ad interactions, and the type of creative assets to determine how different touchpoints impact your conversion outcomes.
With this data, you can compare what happened and what you expected. For instance, you expect results from your videos, but your companion banners may prove more effective.
Data-driven attribution helps you analyse the overall impact of your marketing strategy across the customer journey and how it influences your conversions. You can export your analysis to Google Marketing Platform media tools to optimise campaigns and enhance your ROI.
Create meaningful ads for your targeted audience
Google Analytics 4 allows you to view conversions from YouTube, Google, and other organic channels. You can see which channels are driving growth and which channels lag behind.
On top of that, machine learning ability gives you a deeper understanding of your customers, which you can use to create content your prospects are more likely to engage with.
Combining the effective channel and the engaging content results in an ad that talks to users on their favourite channels. For instance, if you know your users prefer videos over words, you can target YouTube with your engaging video ads.
Hence, Google Analytics 4 enhances the quality of communication between your Google Ads and your targeted audience.
Leverage simplified yet effective reporting
Reporting in Google Analytics 4 zooms in on a particular date or moment of the customer journey. For instance, you can watch a user browsing your product on a tablet at breakfast and research more on its computer at lunch. This data deepens your sales funnel knowledge and enables you to identify areas needing improvement.
When it comes to GA4, less is more. It displays an overview of reports in expandable summary cards instead of using longer reports to cover each use case. Thus, You can quickly identify trends and data irregularities.
Further, you can create your custom dashboard to see the reports that matter the most. And if you combine it with Google Data Studio, you can turn your collected data into a visual-inspired dashboard (full of pie charts, graphs, etc.).
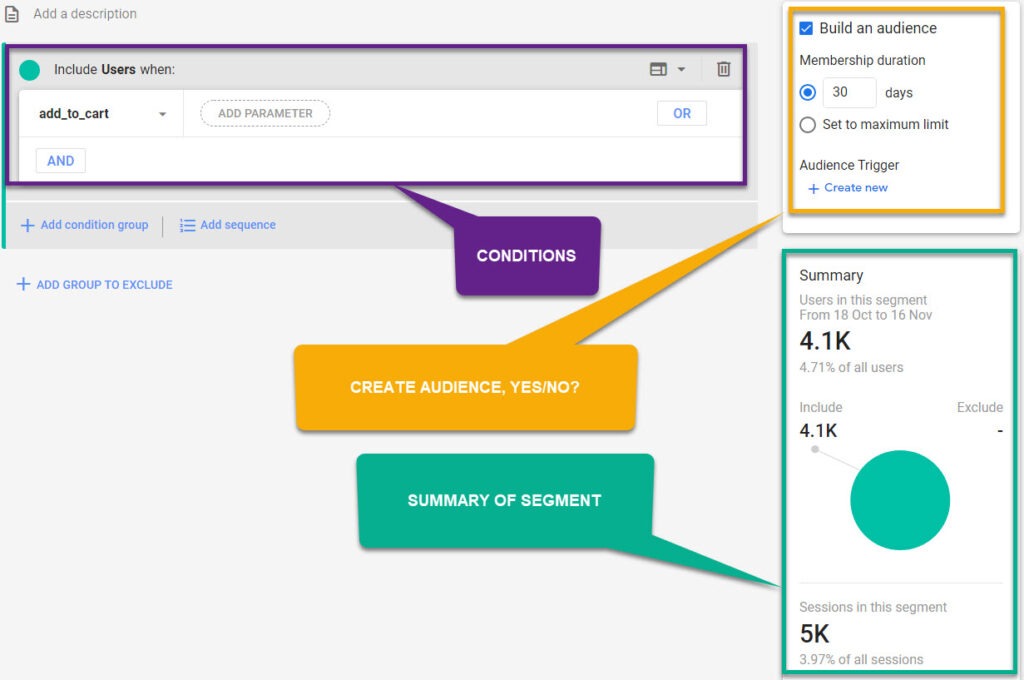
Going beyond greater control over the report, Google Analytics 4 comes with expanded segmentation capabilities. It lets you create segments based on events that are a subset of events on your website or app.
For example, you can create segments of shoppers who abandoned the cart.
With these capabilities, you will get a granular view of your prospects and their behaviour and accurately track their interactions.
Make your users feel secure with Data Controls
Brands have been using cookies for years for tracking users and collecting data that helps them target ads to the right audiences and improve the user experience.
But, 76% of people ignore cookie banners. 86% of people showed growing concerns for their data privacy, and a further 78% were worried about the amount of data collected.
To meet the rising consumer expectations for privacy, Google phased out third-party cookies. Now, you can’t rely on cookies to collect data. Instead, GA4 uses machine learning and artificial intelligence (AI) to fill data gaps that may arise due to a lack of cookies.
This new reporting helps you overcome users’ privacy issues while tracking custom data points about your users across platforms and devices.
You can also use consent mode on websites, which means that the site will retrieve data only when end-users consent.
GA4 also has separate opt-ins for analytics and ads. So users opting out of ads can still provide data for analytics. This feature is vital for businesses and marketers, considering users are tightening up on their privacy matters.
Use AI insights to predict future trends
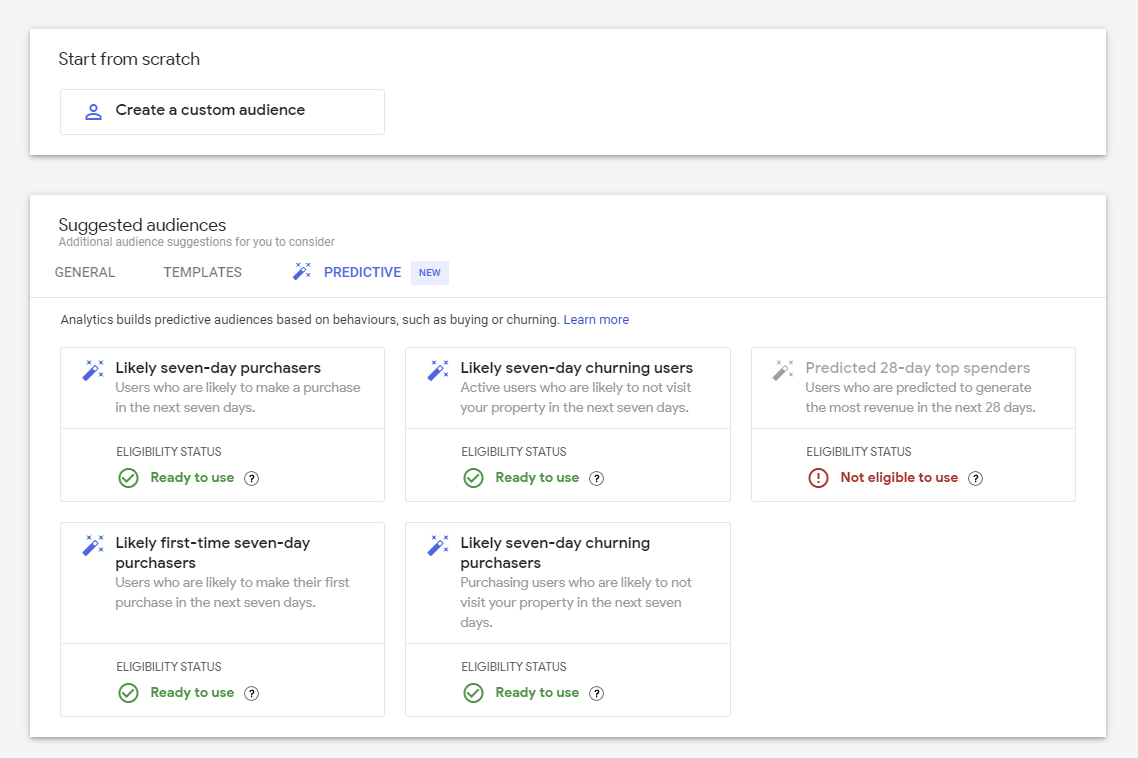
Beyond reviewing and analysing your users’ past behaviour, Google Analytics 4 offers predictive metrics, including purchase probability, churn probability, and revenue prediction. These metrics help you predict future trends and target your audience accordingly.
For instance, you can predict users who are likely to buy in the next seven days or users who are likely to spend over $500 in one go.
Predictive metrics help you improve your retargeting campaigns and enhance your website performance. You can design custom funnels for different audiences as per their behaviours and needs.
Spotting trends before they happen puts you ahead of your customers and acts immediately on their current demand.
While there are many advantages of the new Google Analytics 4, some things may delay your migration from existing Universal Analytics to GA4.
Here are some disadvantages of Google Analytics 4:
It has a steep learning curve
Since there are a ton of changes, it will be challenging to adapt to the new environment of Google Analytics 4.
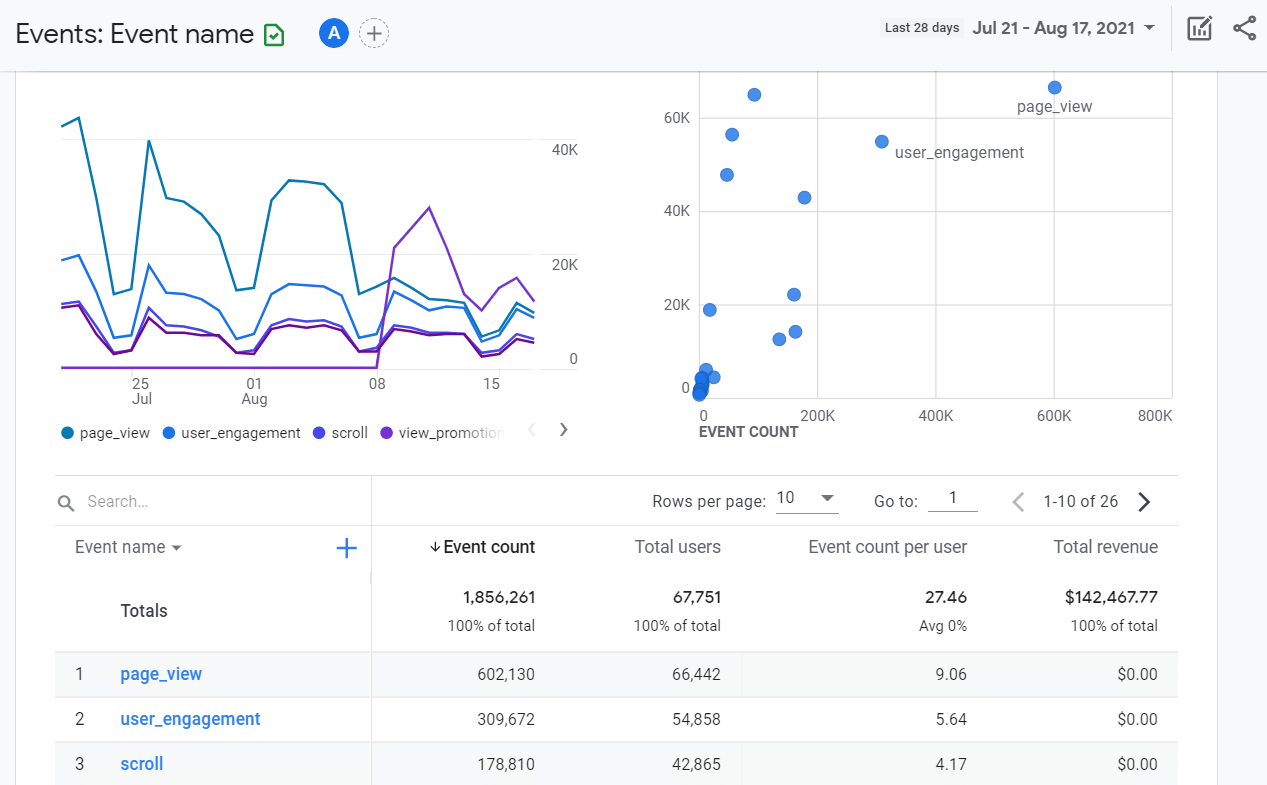
Let’s say, that with Universal Analytics, you may be used to analysing sessions and goals, but with GA4, you have to get familiar with event tracking and conversions. While it seems interesting, these events will leave you with information like this:
As you can see from the above example, it requires a big learning curve to make sense of those graphs and numbers.
It’s time-consuming
Although you can configure a basic website or app setup in Google Analytics 4, you won’t be satisfied with basic events.
You have to introduce custom events to accurately survey users’ behaviour at each funnel stage on the website or mobile apps. Also, you may not feel comfortable analysing in the new informative environment of GA4, let alone making essential decisions.
So whether you’re an independent Google Analytics expert preparing traffic reports for clients or part of a company working on SEO strategies to bring business, investing time in this new Google Analytics 4 may feel like a luxury you can’t afford.
You can’t import past historical data in GA4
If you are a long-term Universal Analytics user, you can’t move your historical data to Google Analytics 4. You have to start from scratch in terms of data collection.
Additionally, after July 1, 2023, you’ll only be able to access previous data in standard Universal Analytics properties for six months. That’s another reason why you should start exploring GA4 now.
GA4 will start collecting your data for the site and app as soon as you set up your account. It will take more than a year to have enough data and compare it in GA4. Till then, you have to switch between Universal Analytics and GA4 to see your previous data.
It seems like running Universal Analytics and Google Analytics side-by-side is the best solution to access historical data while building data in the new platform and future-proofing your analysis hub for when Google discontinues Universal Analytics.
How to Set Up Google Analytics 4?
There are two ways to set up a Google Analytics 4 account depending upon if you want to use it exclusively or if you want to use it together with Universal Analytics. The latter is recommended considering you need time to build data and learn new GA4 features.
Let’s look at how to create a new property in GA4 that you can use alongside your current analytics property; then, we will peek into setting up a new GA4 account from scratch.
Setup GA4 in tandem with UA
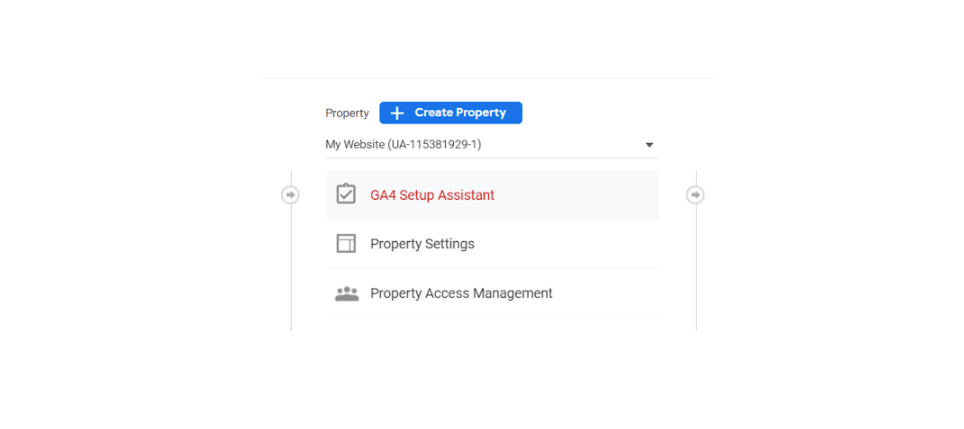
If you already have a Universal Analytics property for your website, you can set up a Google Analytics property with GA4 setup assistant.
For a dual setup, you need to do the following:
- Login to your Google Analytics Account
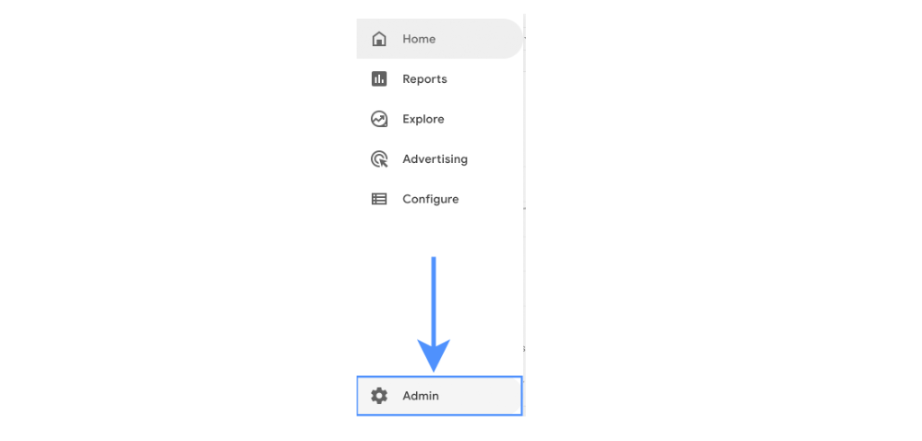
- Click “Admin” at the bottom left of the page
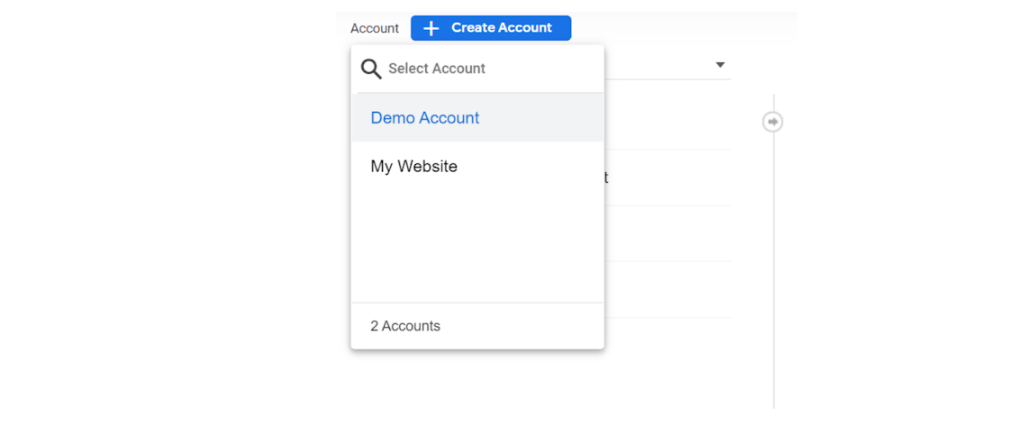
- Select the desired account in the Account column
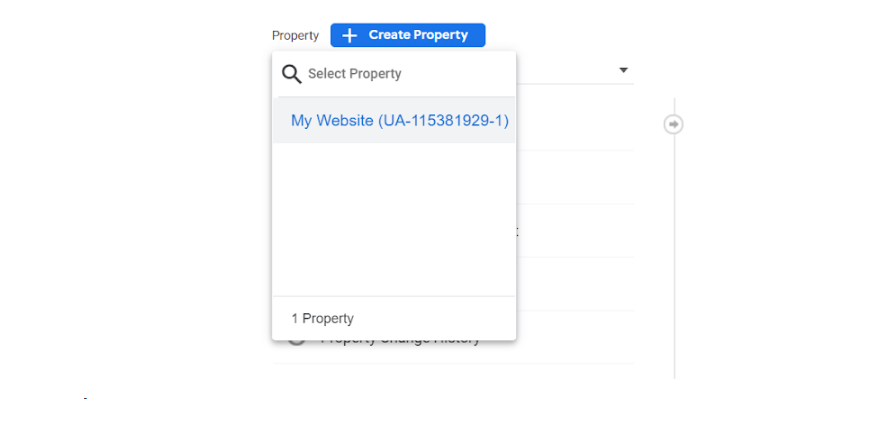
- In the Property column, choose the Universal Analytics property that collects data for your website/app
- Select GA4 Setup Assistant in the Property column
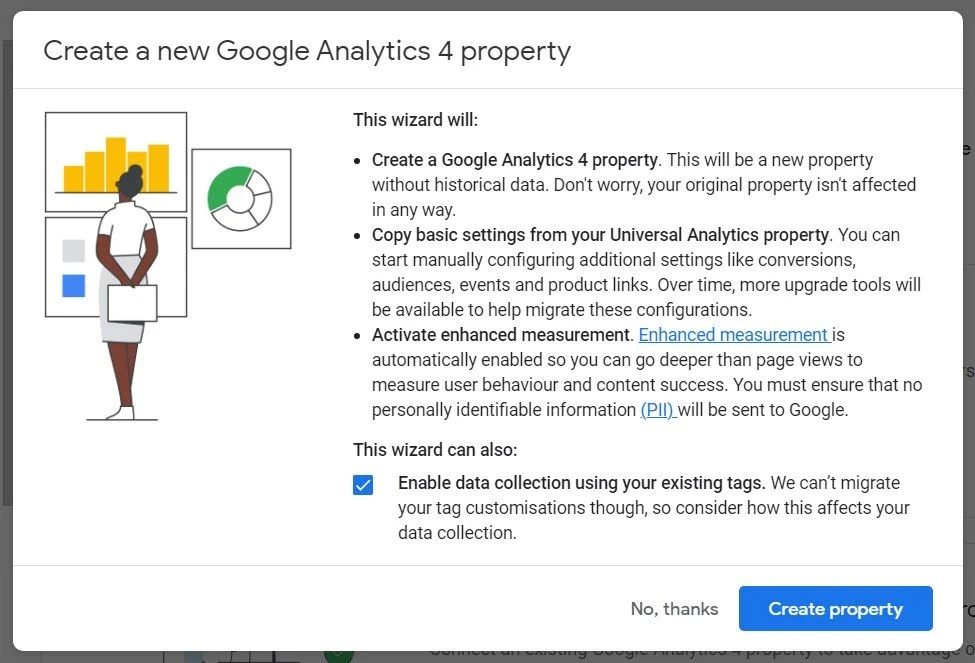
- Click the large blue button “Get started” under “I want to create a new Google Analytics 4 property”
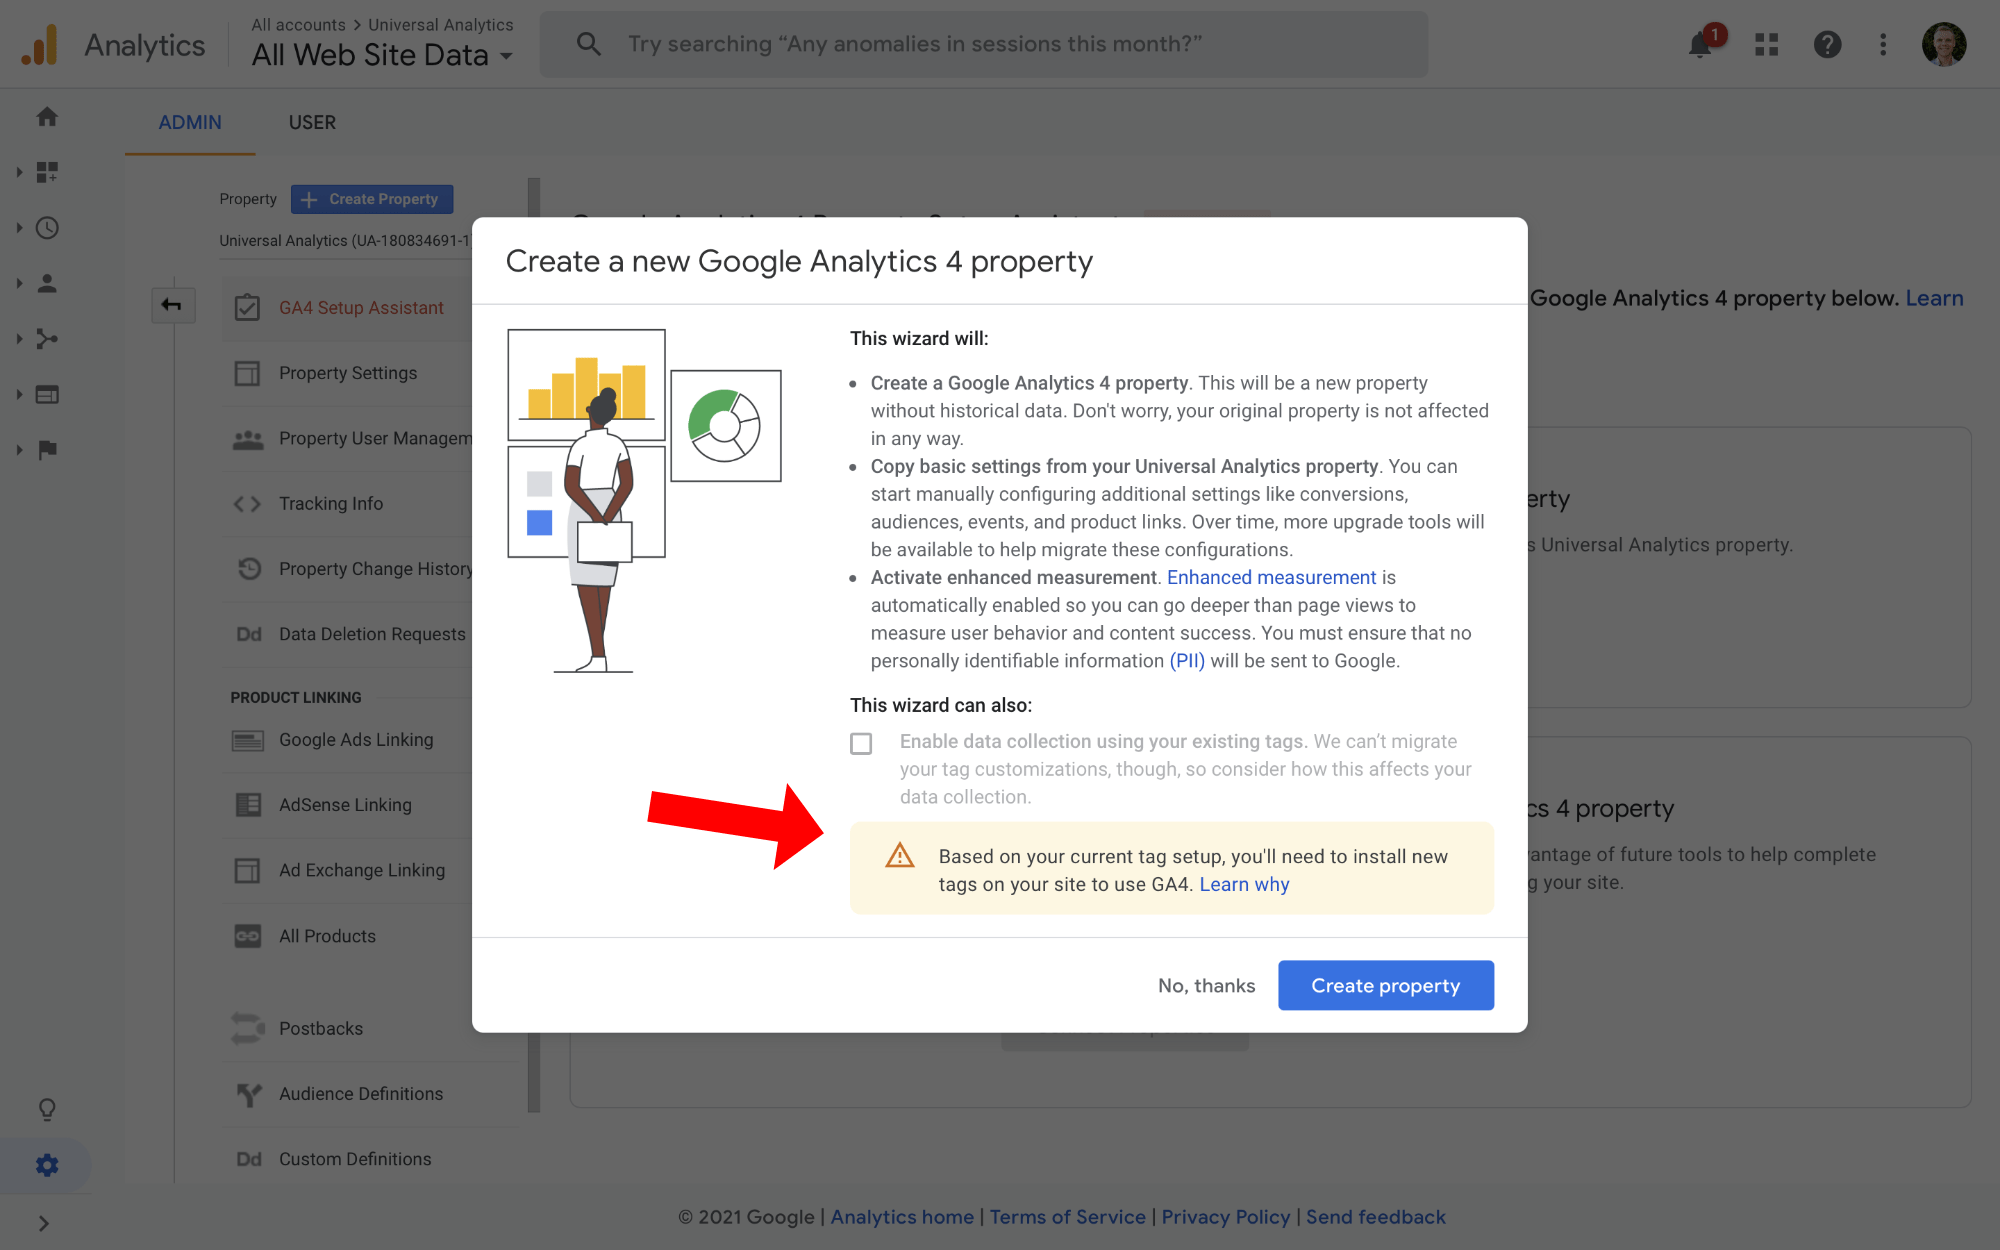
- If your site uses gtag.js (global site tag), select “Enable data collection using your existing tags.”
For newbies: The global site tag (gtag.js) is a Javascript library that allows you to send event data to Google Analytics. The reports show data in your property when you add the gtag.js to your web pages. Each web page should have only one global site tag.
- Finally, click “Create Property”
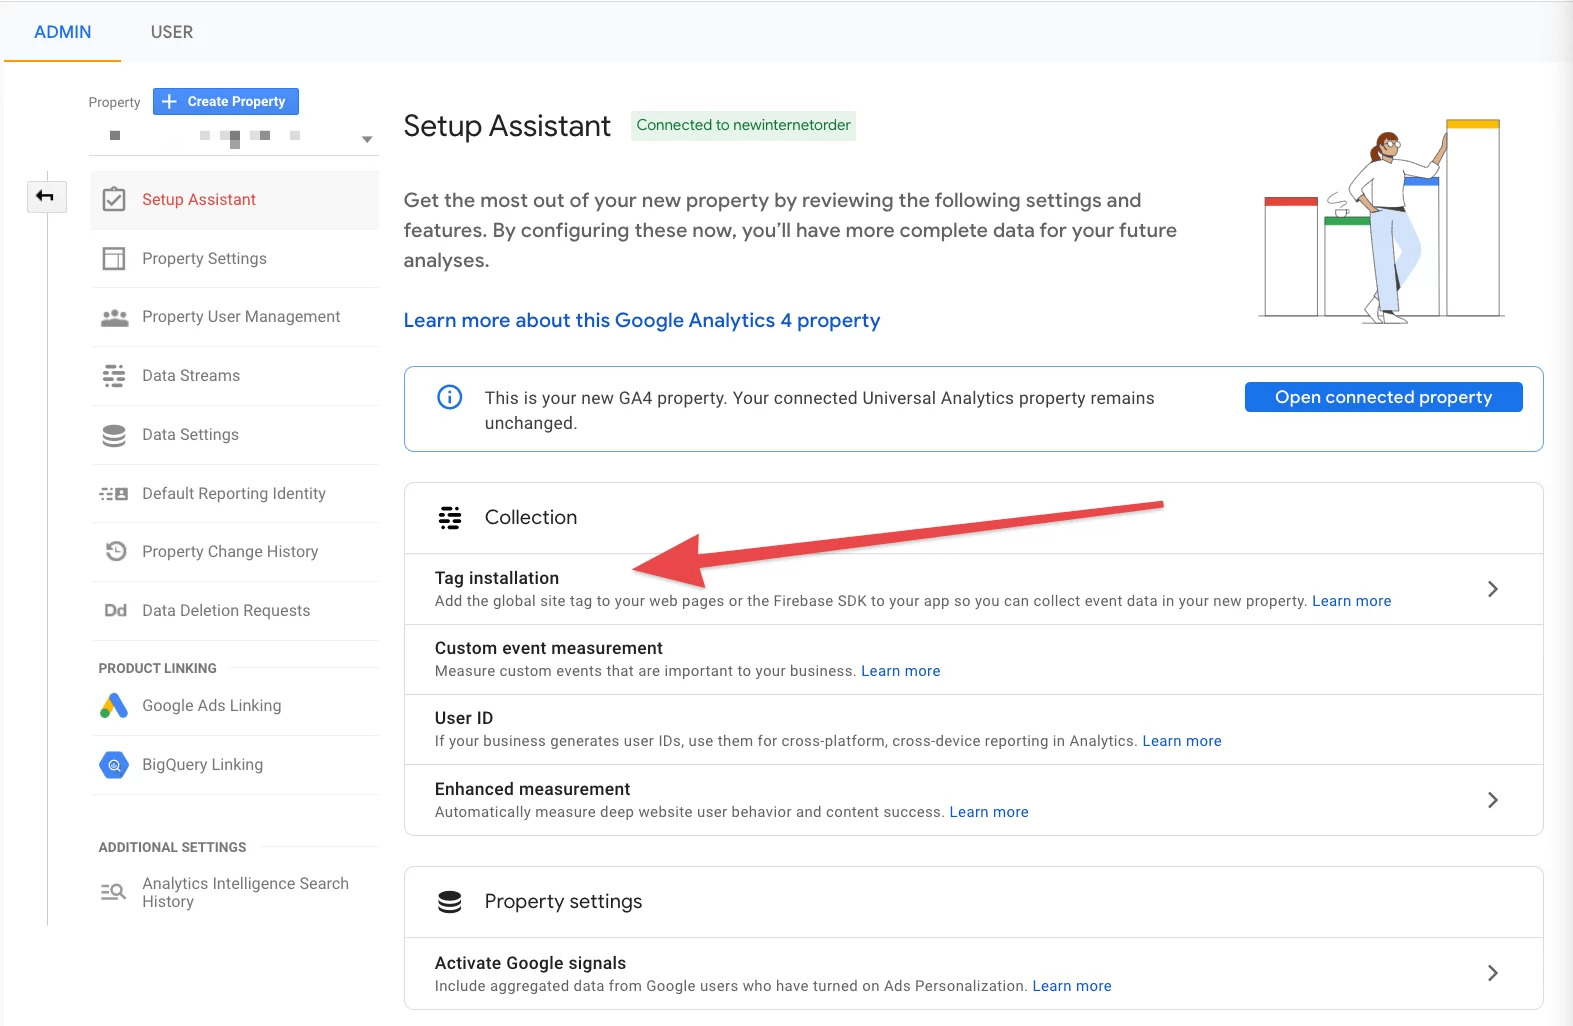
Once you complete the process, you will get the “You have successfully connected your properties” note at the top of your GA4 property Assistant page.
Now let’s have a brief on setting up a Google Analytics 4 account solely.
Set up a new Google Analytics 4 account
There are only three steps to creating a Google Analytics 4 account. It’s a straightforward process:
- Go through Setup Assistant
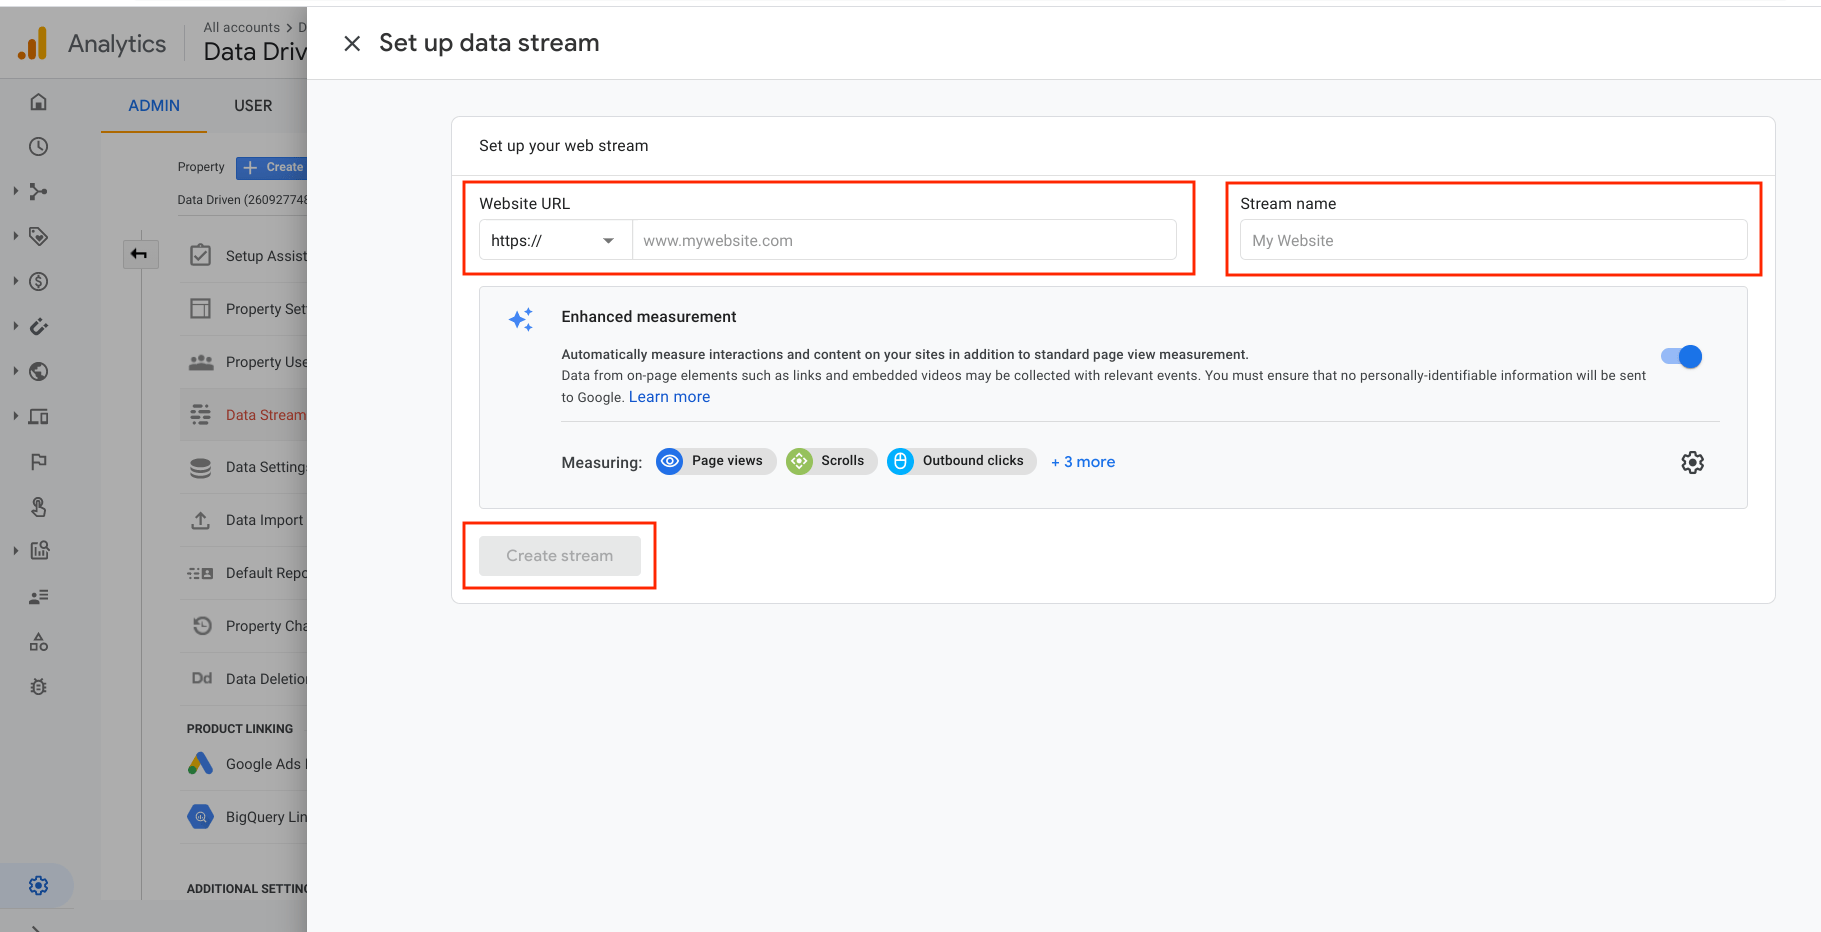
- Create a new data stream based on whether it’s a web, iOS app, or Android app
Note: A data stream is a flow of data from a user touchpoint (like a website, app, etc.) to Analytics. Each GA4 property can have up to 50 data streams, including app and web data stream, with a limit of 30 app data streams).
- Then enter details like your website URL
And you are done.
Note: The GA4 Setup Assistant works automatically with the global site tag (gtag.js). If you use a website builder like WordPress or Google Tag Manager (GTM), you need to add the Analytics tag yourself.
Google Tag Manager is a tag management system that allows you to instantly configure and deploy tags on your website or app for site analytics, conversion tracking, remarketing, etc.
Once you create your property, the setup assistant automatically activates enhanced measurement events (it measures interactions with your content) in your GA4 property.
You still need custom code to track third-party elements and form submissions, but the most basic types of event tracking are automatic.
How to Use Google Analytics 4 Effectively?
Once you set up GA4 correctly, you might be wondering how to use it. Although Google Analytics 4 has only been around for a few months, marketers have already figured out multiple ways to leverage it.
You can know hundreds of things about your website or mobile apps with GA4, so how you use it depends on the data you want.
Here we’ll go through the basics and the best ways to use Google Analytics 4 reports to understand your website visitors, where they come from, what they are doing there, and the multi-platform journey they take to reach the conversion.
Let’s begin.
1. Summary Report
When you first log in to GA4, you’ll notice the homepage summarizing the overall traffic, conversions, and revenue for the property you created. It’s a quick check to ensure everything is going as expected.
This home page gives you the answers to the following questions:
- Where do new users come from?
- Which are your best-performing campaigns?
- Which pages and screens score the maximum views?
2. Realtime Report
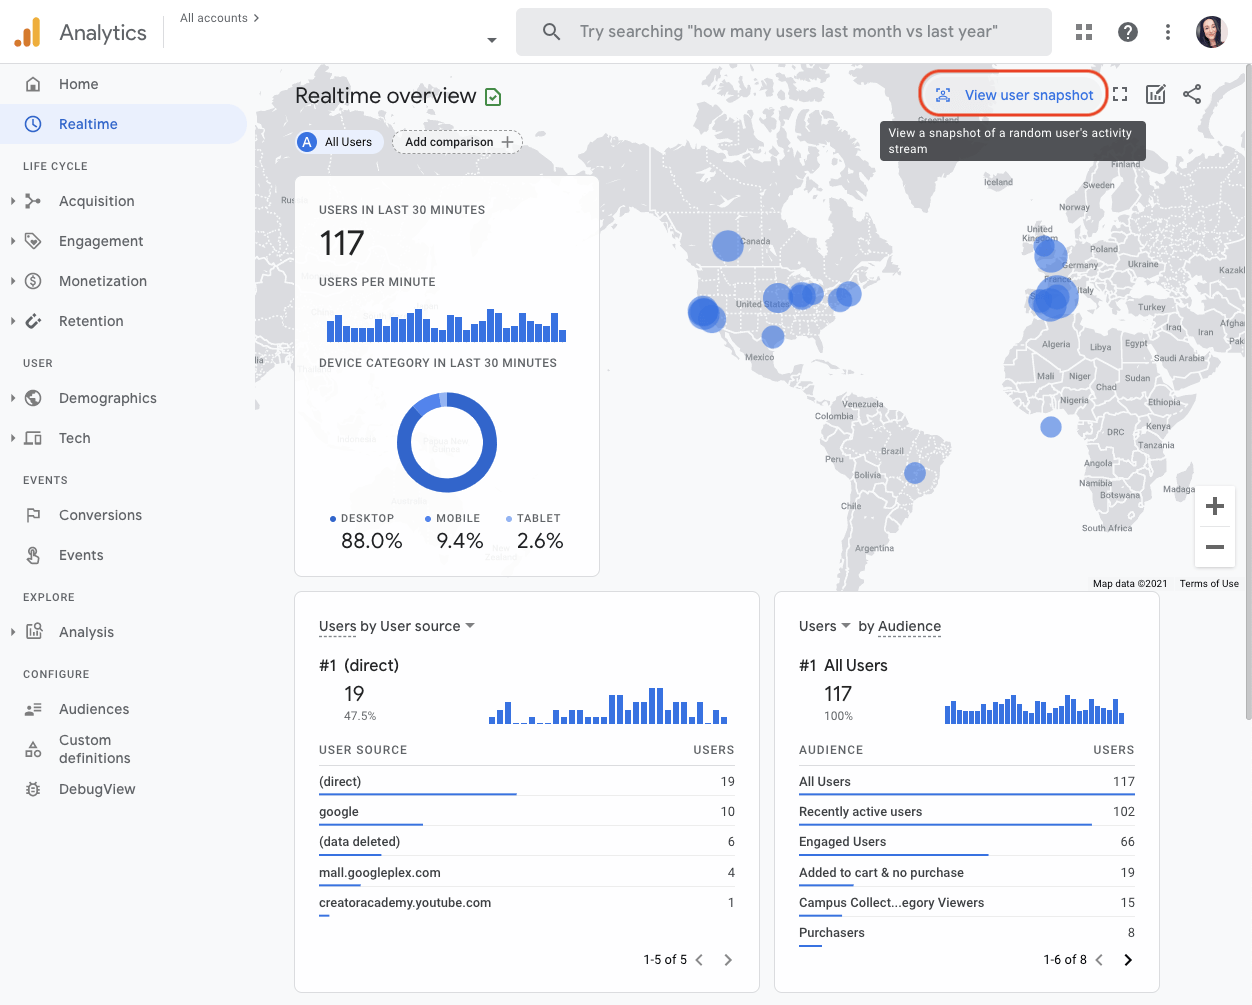
The next default report is the Realtime report in the left navigation. It displays events that occurred within the last 30 minutes.
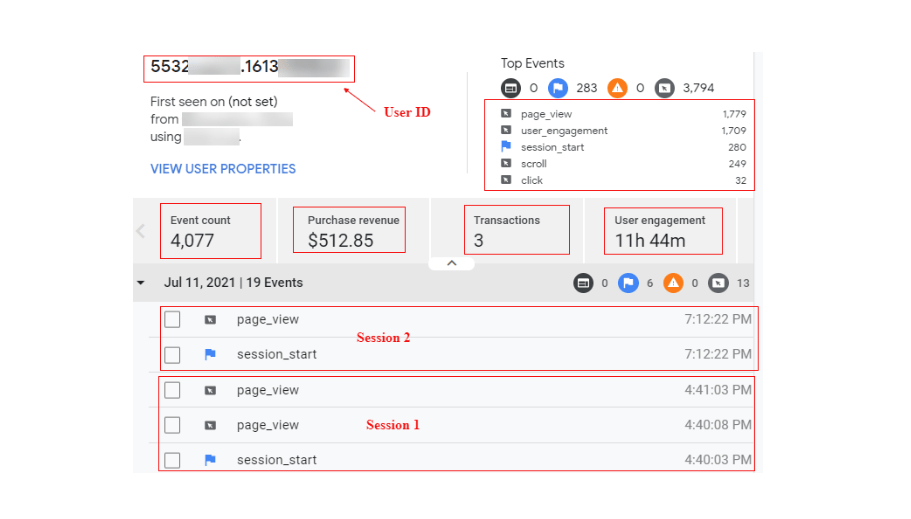
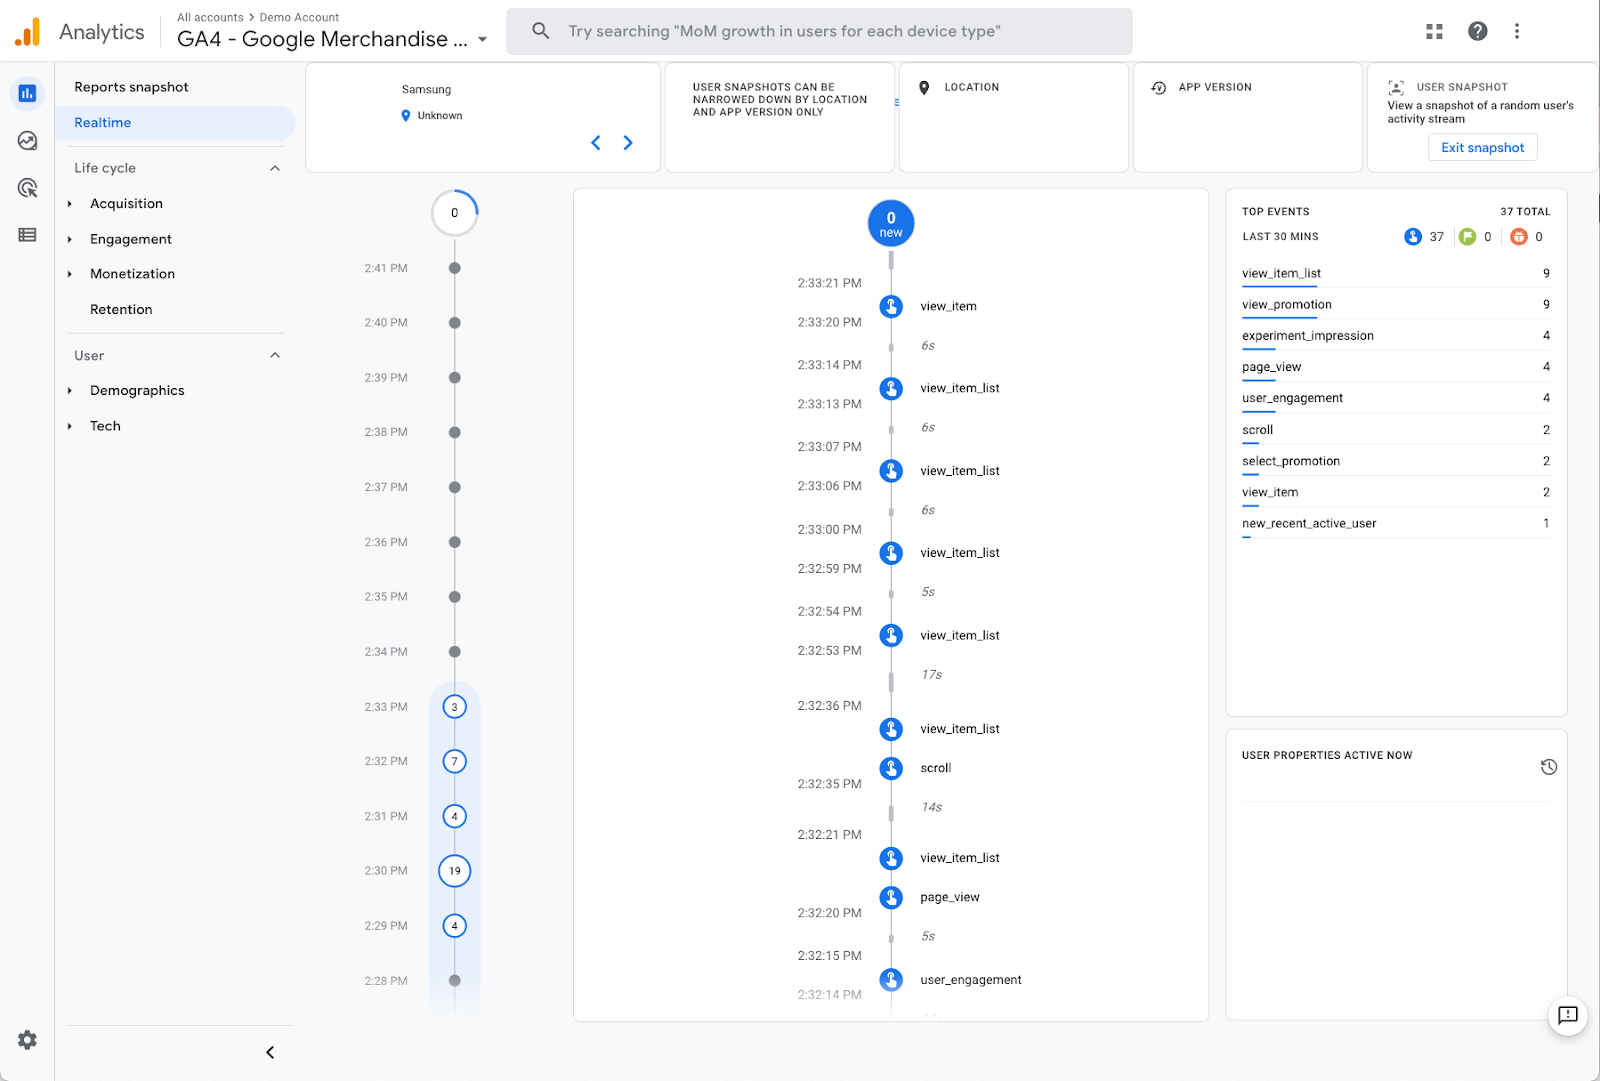
One of the cool features of the Realtime report is “View User Snapshot” at the top right corner. It gives you an informative snapshot of a single user, including the user’s location, device, and real-time engagement with your site or app through events triggered.
3. Life Cycle Report
The Life Cycle report shows the users’ lifecycle stages, including acquisition, engagement, monetization, and retention. If you pay close attention, all four stages mirror the funnel of awareness, consideration, purchase, and loyalty.
Life Cycle reporting answers the following questions:
- How do users enter your conversion funnel?
- How do users behave once inside the funnel?
It also includes user reports on demographic data, technology, events, and conversions.
4. Explorer Report
As the name suggests, Explorer reports let you explore the data and fetch insights. It’s a collection of advanced analysis tactics, that go beyond the standard reports to help you uncover more profound insights into customer behaviour.
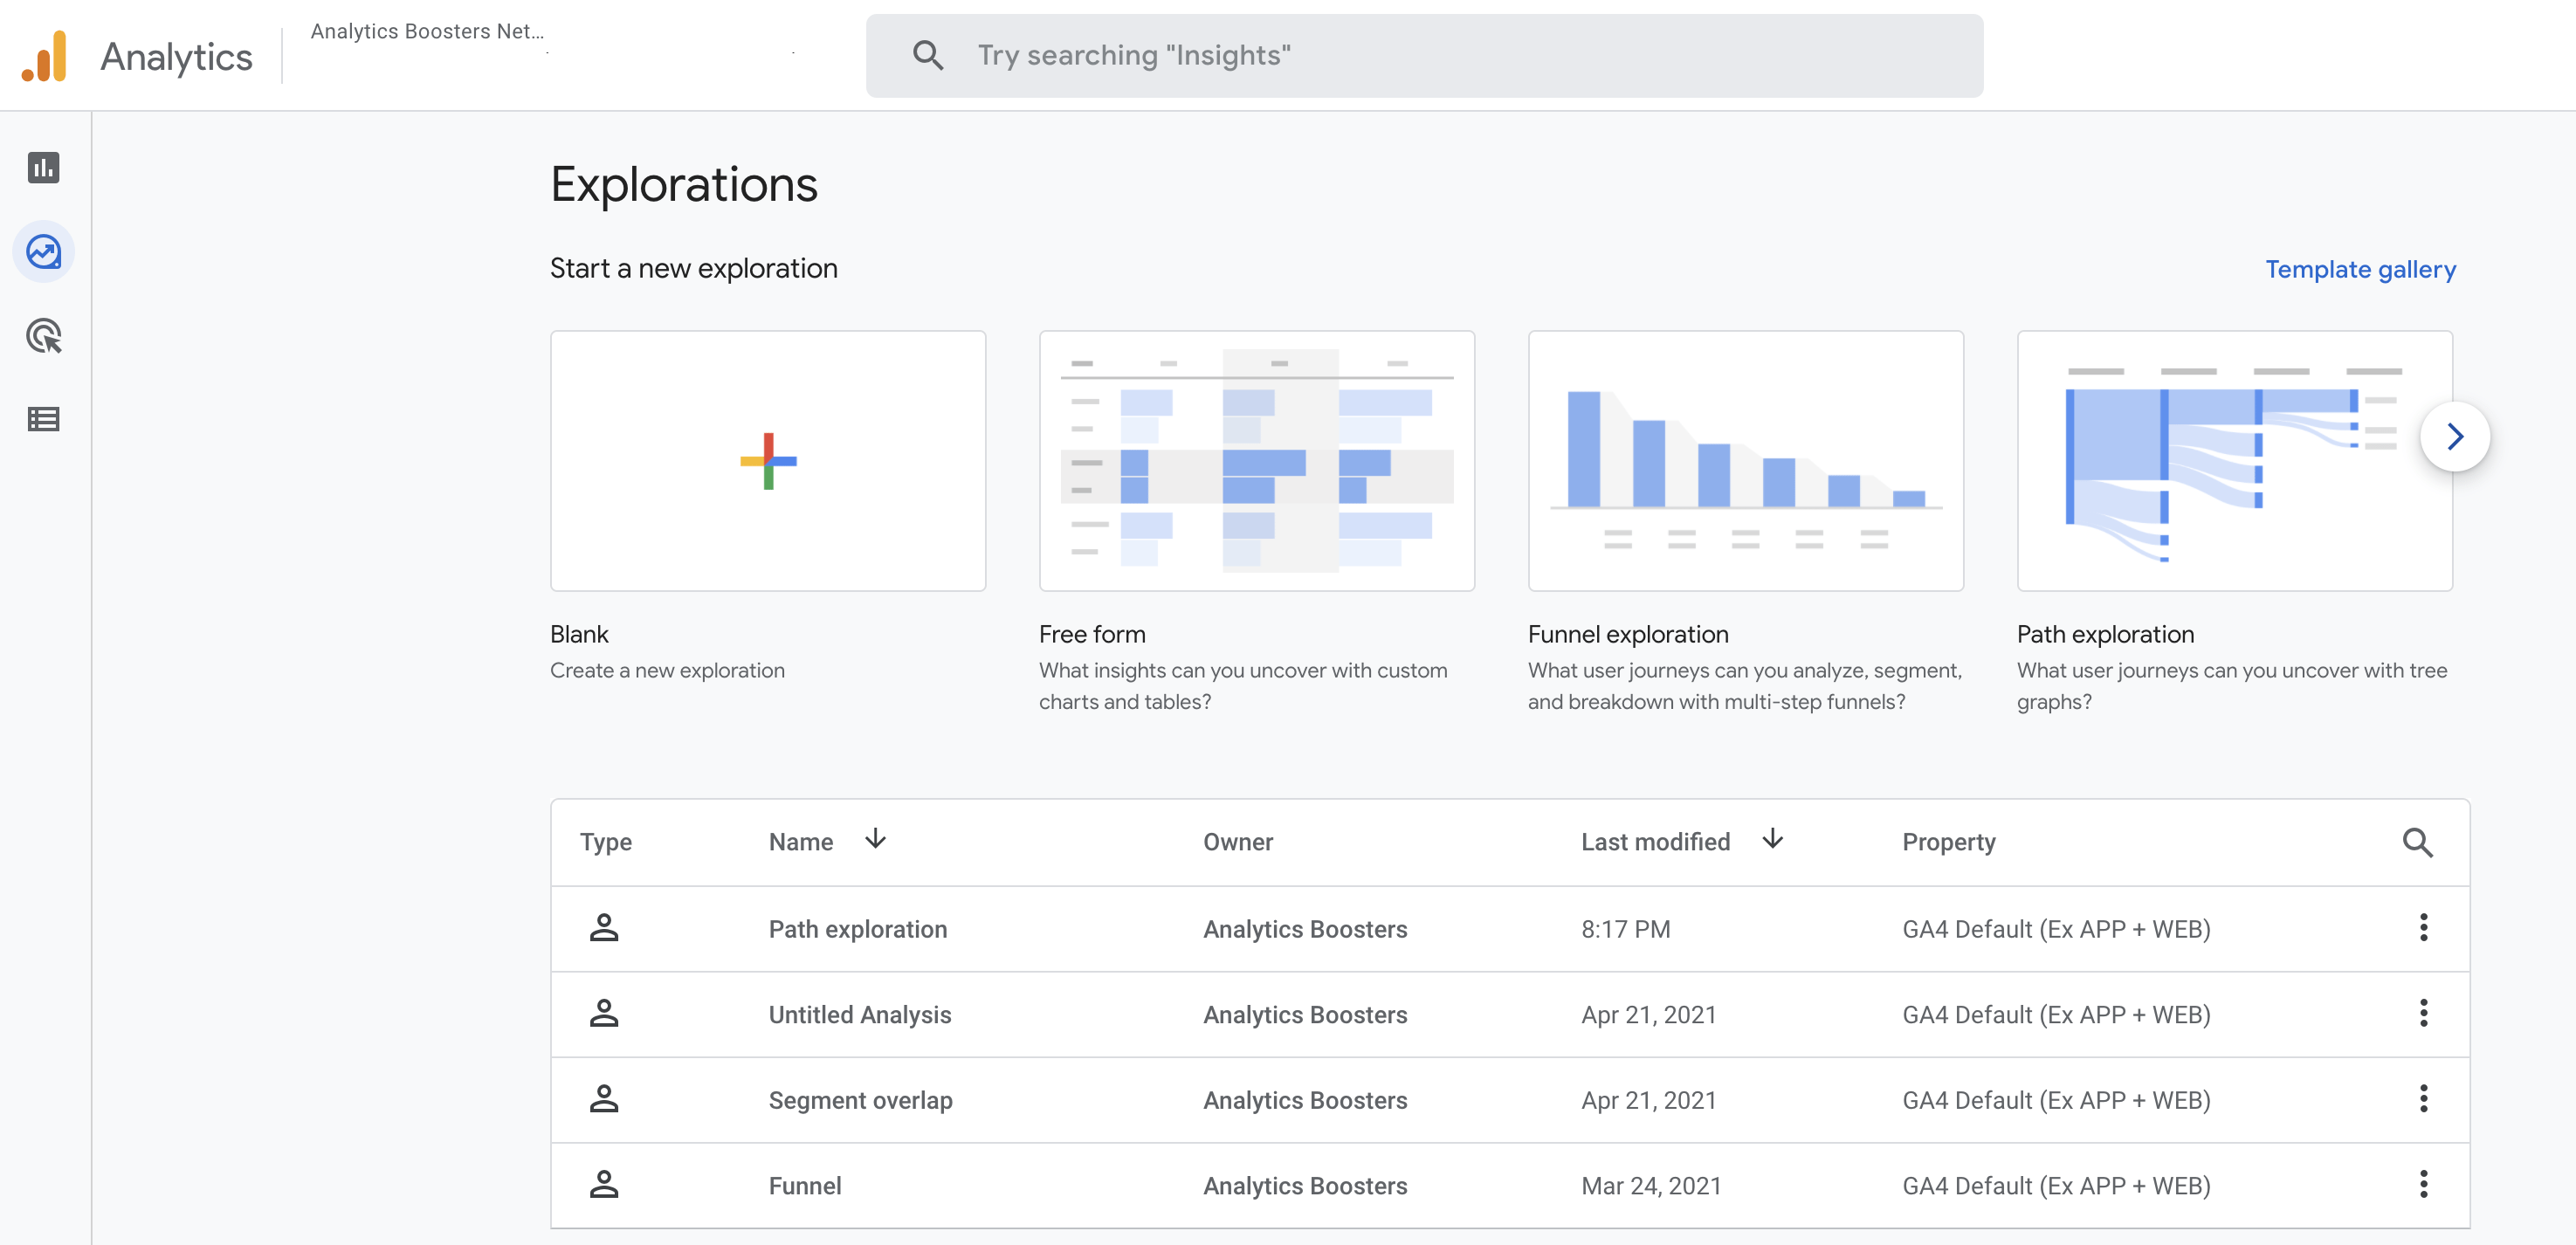
In the Explorations section, you’ll see a variety of templates availing different types of analysis reports, including:
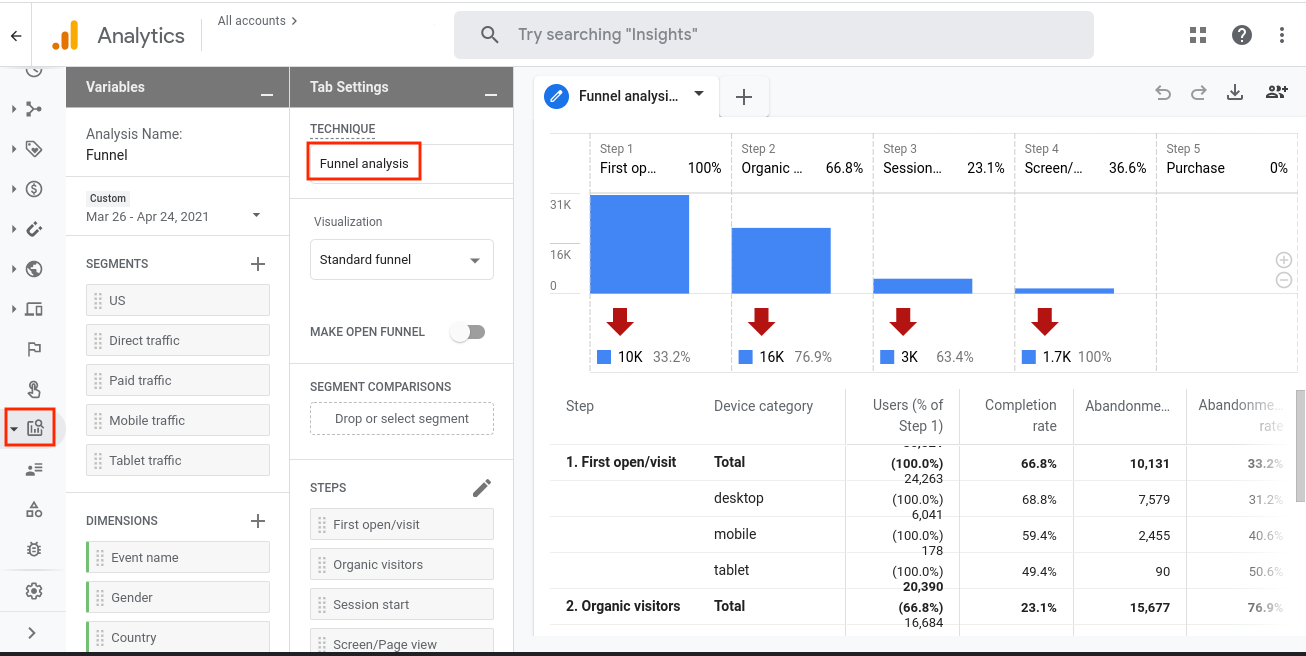
- Funnel Analysis: Here you will find out how website visitors turned into one-time shoppers and how one-time shoppers become loyal customers. You can also visualize the steps customers take to complete an event and how well they succeed or fail at each step.
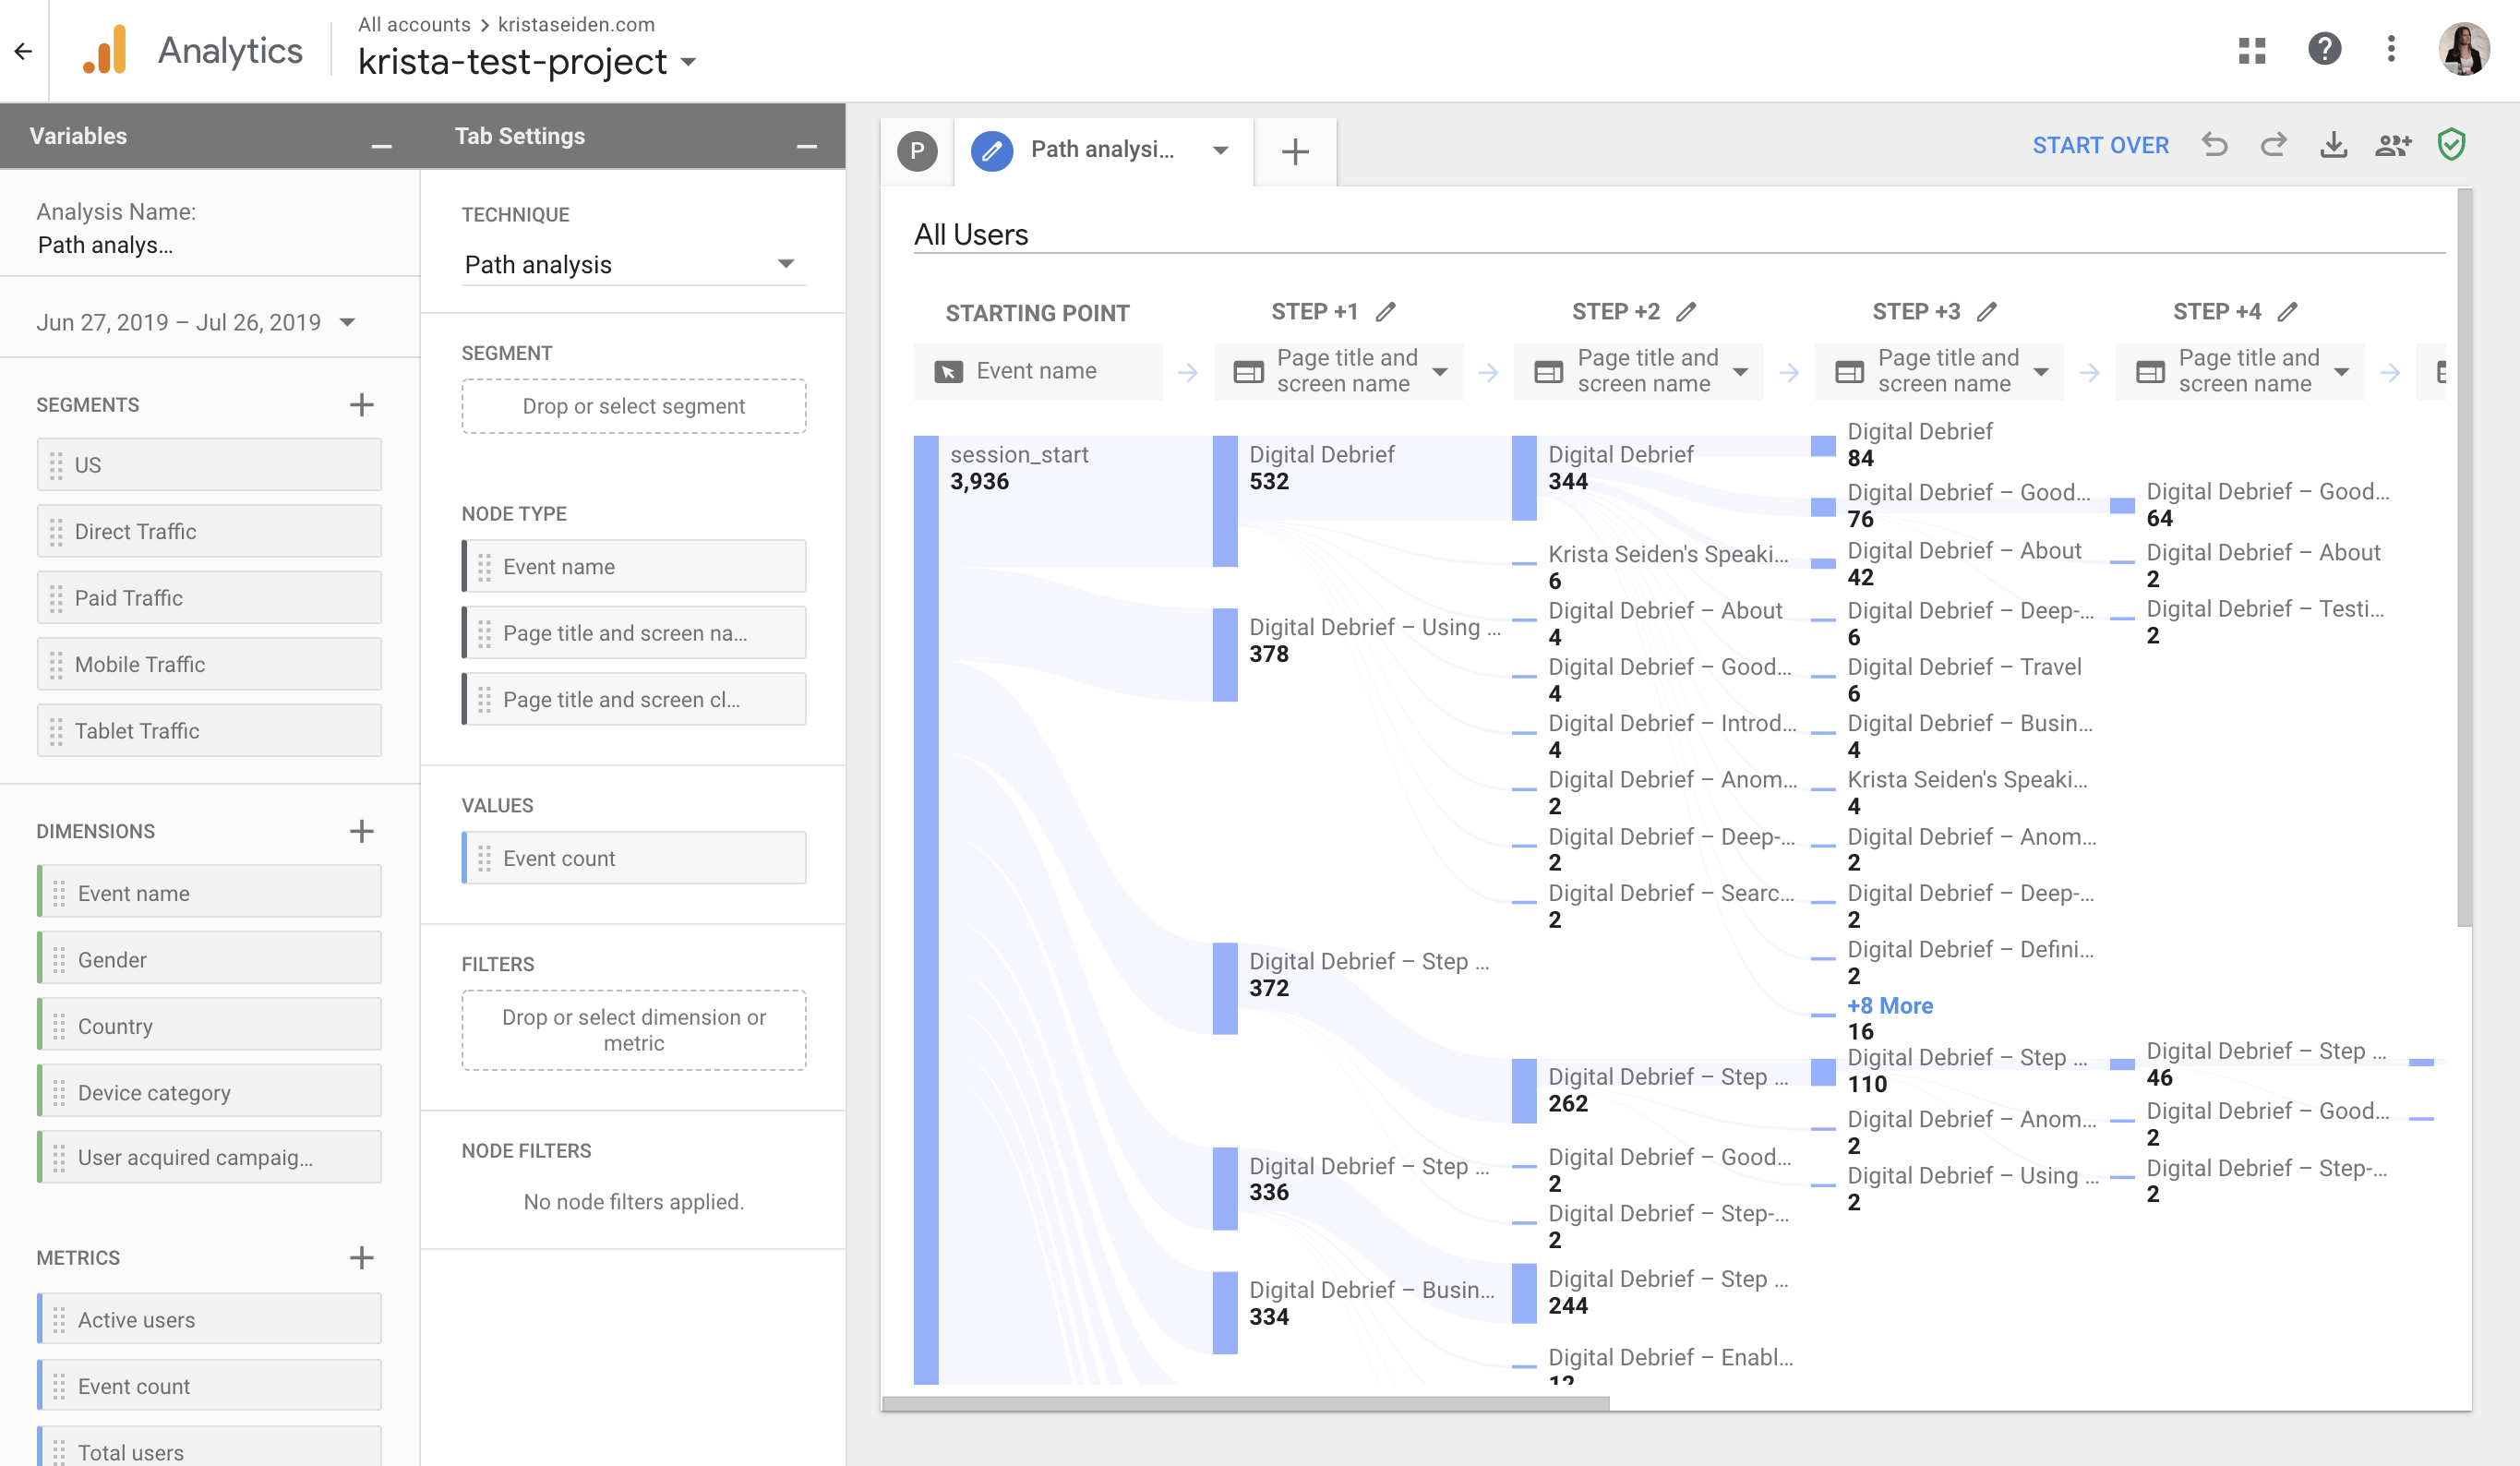
- Path Analysis: It offers the event data in a “tree graph” format. It’s a series of events users trigger during their journey to your website or app. It helps you identify users’ looping behaviour indicating where they have become stuck.
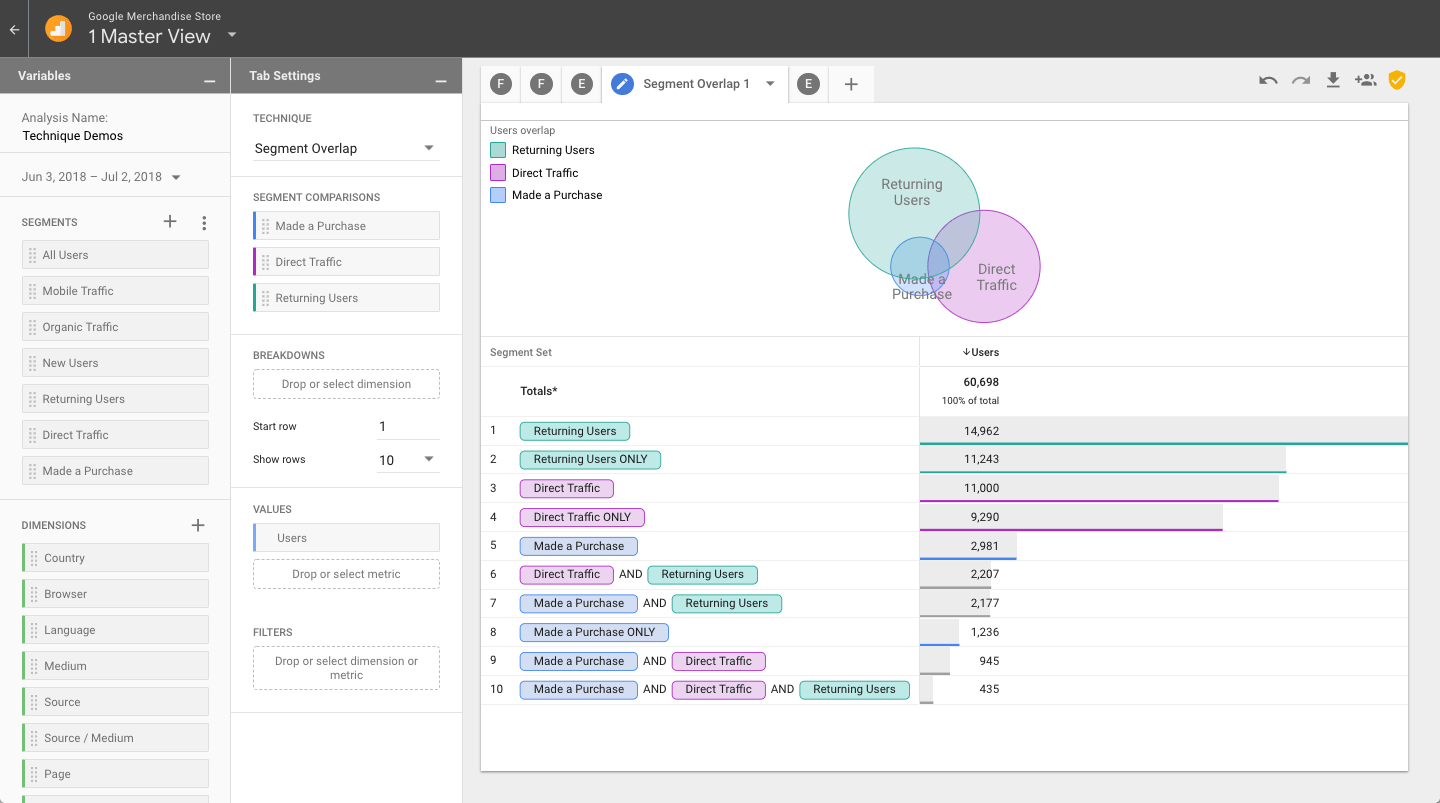
- Segment Overlap: It lets you compare up to 3 user segments to highlight how those segments overlap and relate to each other. You can create segments to isolate specific audiences based on complex situations.
For instance, the below example showcases the intersection of new users, mobile traffic, and converters segment:
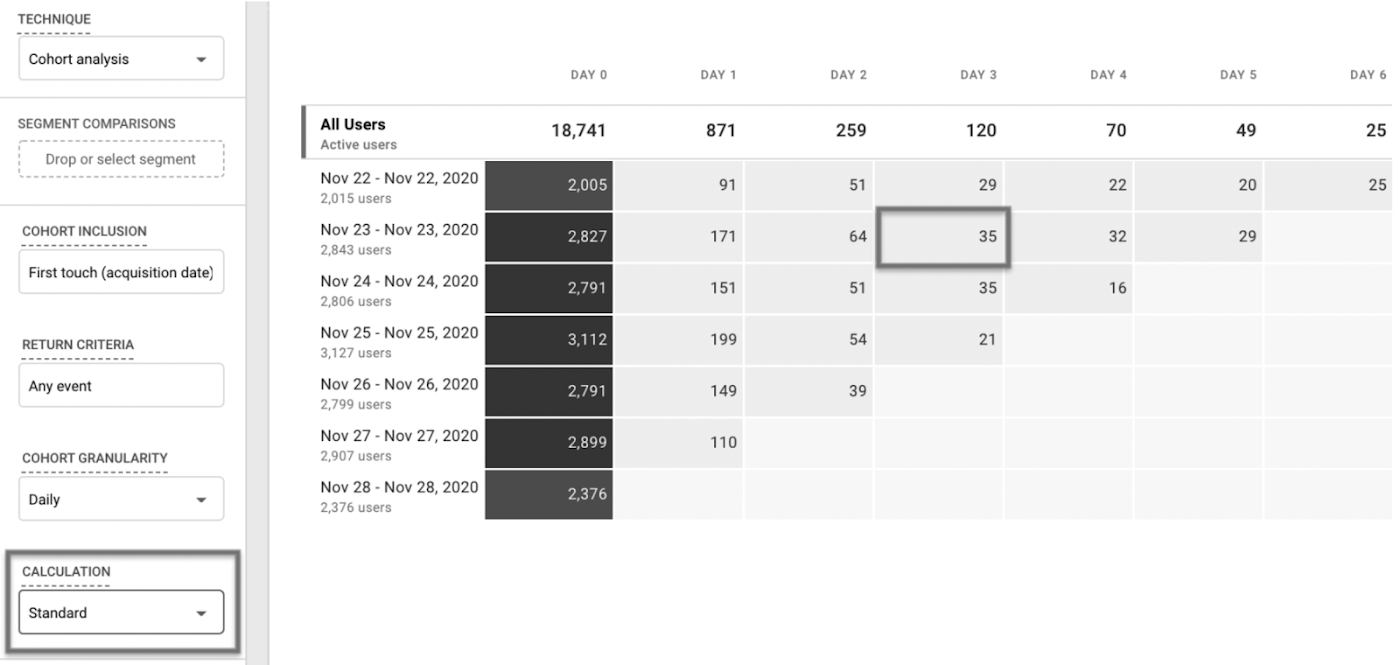
- Cohort Analysis: A cohort is a group of users having common characteristics like the same conversion date. You can create a cohort report to see the time users take to convert in relation to a particular marketing tactic.
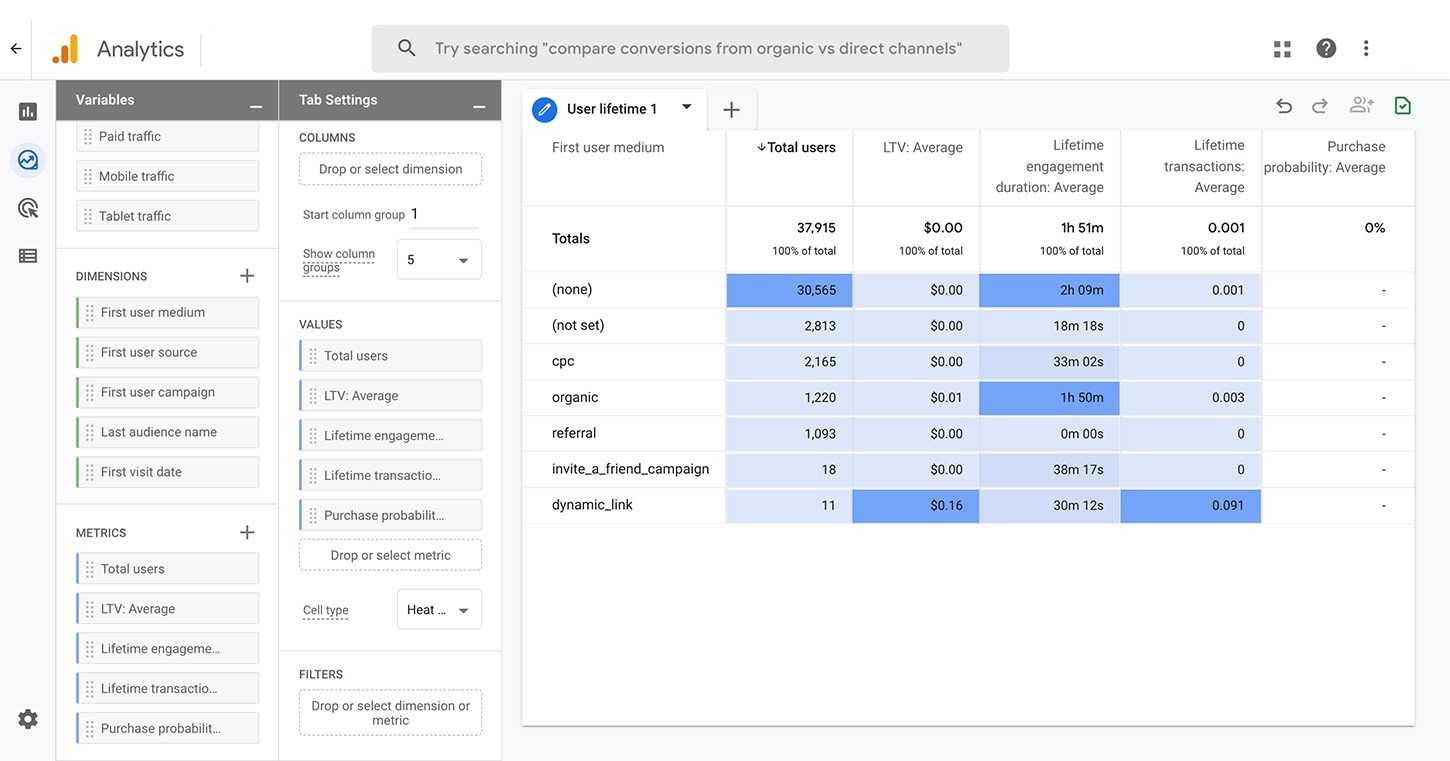
- User Lifetime: It lets you create a user lifetime report to unearth the sources driving users with the highest lifetime revenue—not just revenue for a specific month. You can also create custom reports to gain detailed insight into how your website and mobile app are performing.
Hence, Google Analytics 4 allows you to identify the marketing campaigns acquiring the most valuable users with the highest purchase potential and lowest churn rate probability.
Now you have lots of reports in hand to explore and learn GA4. Still, it can be complicated and clunky to pull out the gems of information from the sea of reports.
But don’t worry!
We got your back.
How to Extract Strategic Information from Google Analytics 4?
Although the GA4 interface and terminology are a lot different from previous versions, the analysis basics are similar. Your hard-earned knowledge and skills still carry over.
Here are the top four GA4 reports you need to get started and running:
1. Site Traffic
To begin with, how will you know if your marketing campaigns are paying off?
For this, you need to measure site traffic through users or sessions. Users represent individuals who visited your website, and sessions are the number of times a user visited your website.
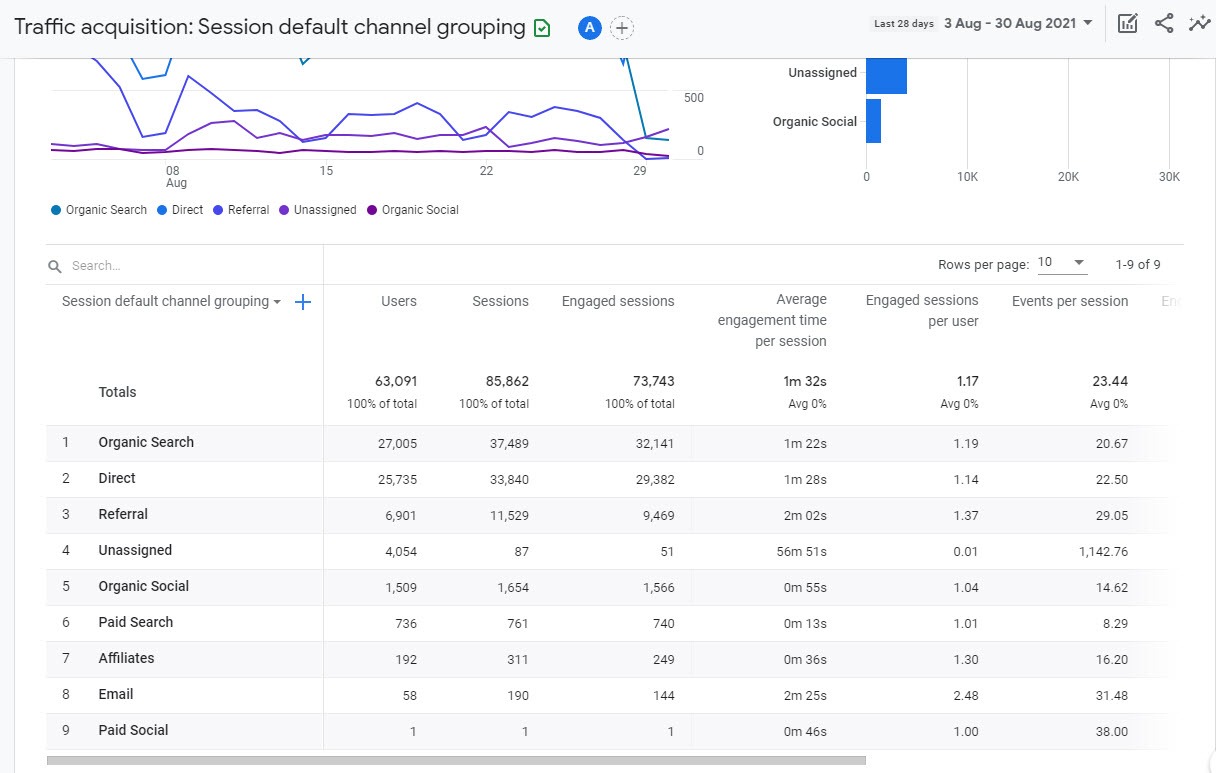
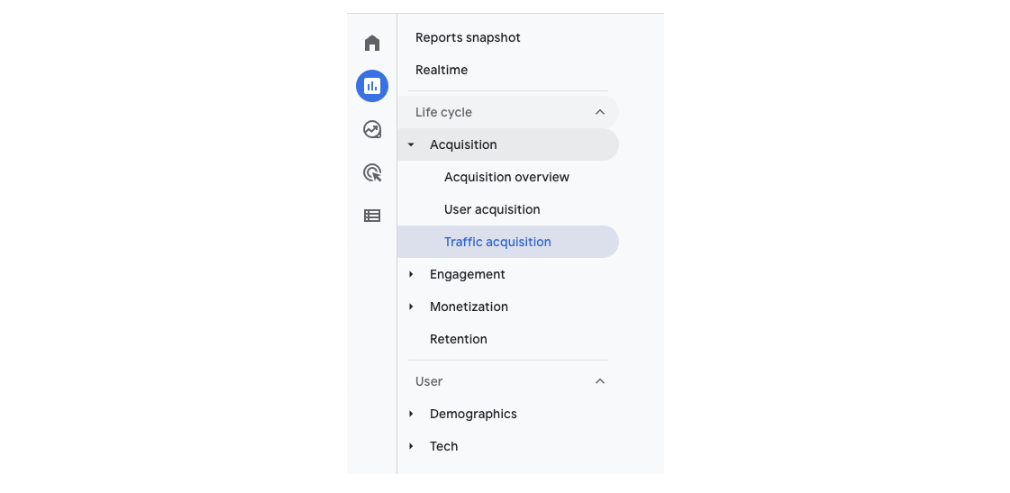
To view site traffic in Google Analytics 4, click the Life Cycle -> Acquisition -> Traffic Acquisition.
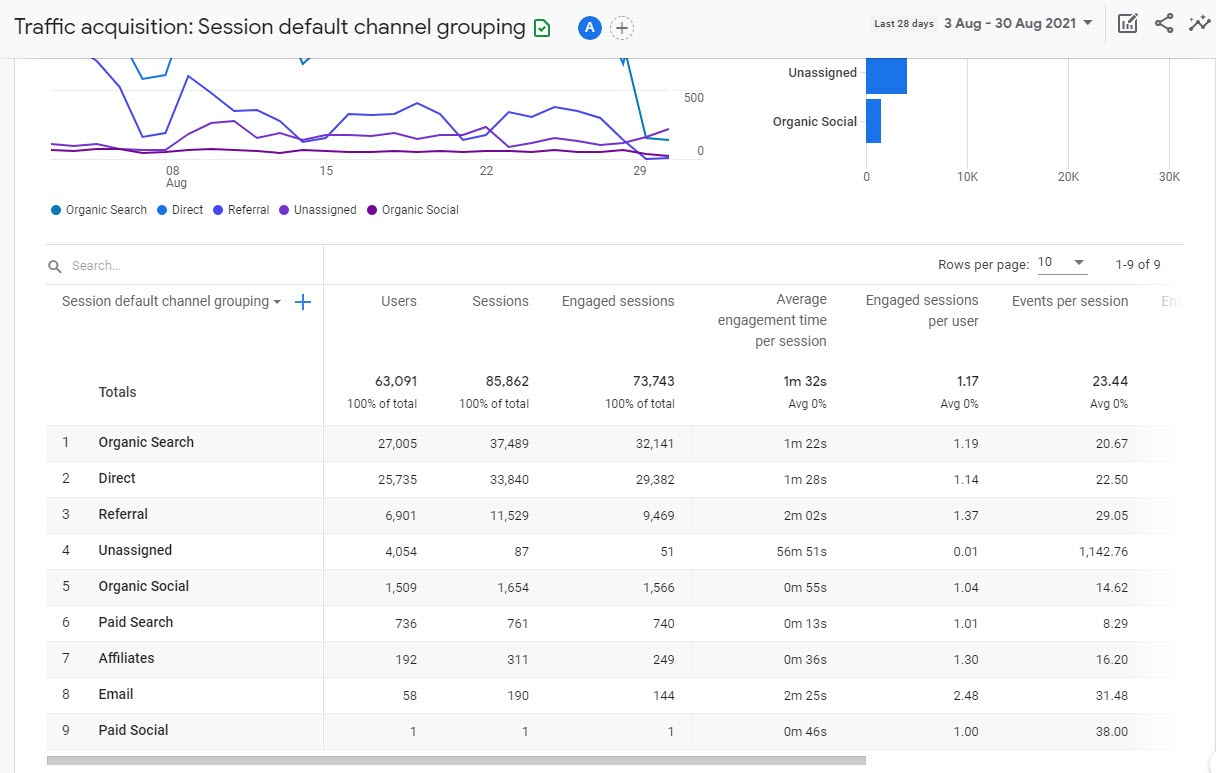
Traffic acquisition shows you the reports of default channel grouping—a grouping of related traffic sources. For instance, the “Organic Search” grouping given below is a list of search sites or traffic matching Organic mediums.
These reports help you understand whether your site traffic from specific mediums is improving or not. Also, you will know where your site traffic is coming from. For instance, the above example shows the traffic coming from Organic Video.
2. User Engagement
Once you understand where your traffic is coming from, your next target is to analyse the content your users engage with.
The user engagement metric tells you when your app or web page is in focus. If your site or app is running, but the page or screen is not displayed, Analytics doesn’t collect the data. Hence, this metric helps you understand when users are active on your website or app.
In Google Analytics 4, you will find user engagement metrics based on engagement rate, engaging sessions, average engagement time, etc.
Engaged sessions offer context in understanding on-site user behaviour as it includes any user spending at least 10 seconds on the page.
You can adjust the length of time from 10 seconds to 60 seconds within Data Streams -> More Tagging settings.
Engaged sessions are helpful for bloggers and publishers. It tells you whether users had a positive experience while reading your blog or watching a video, even if they don’t convert.
If you want to keep visitors engaged on your site for longer or until they convert, you should keep an eye on this metric.
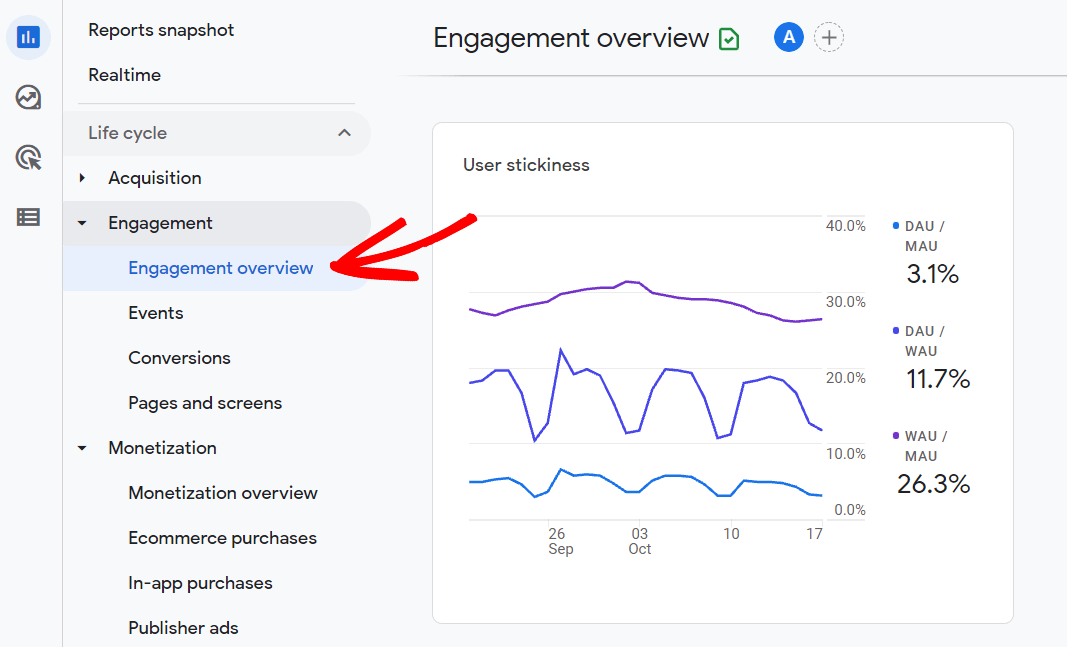
In GA4, you can find engagement metrics in Life cycle -> Engagement -> Overview. It shows the overall average engagement time—the average time users spend on your site.
Another vital engagement metric is the average engagement time per page. It tells the time users spend on each page.
In GA4, Go to Engagement -> Pages and Screens to find the “Average engagement time” column.
This metric may surprise you as it reveals pages have longer or shorter visits.
Analysing all the engagement metrics helps you understand which content delivers higher engagement and which low-engaging content requires further analysis.
3. Events
An event is a user’s interaction with your website or mobile app. However, this interaction does not necessarily align with your business goals.
For instance, a user watched your entire video, but he didn’t subscribe or sign up for your newsletter. It still counts as an event giving you an idea of whether your video is engaging enough for your targeted audience to continue watching or subscribe.
Since GA4 is event-based, some events like first_session, user_engagement, etc., are automatically tracked.
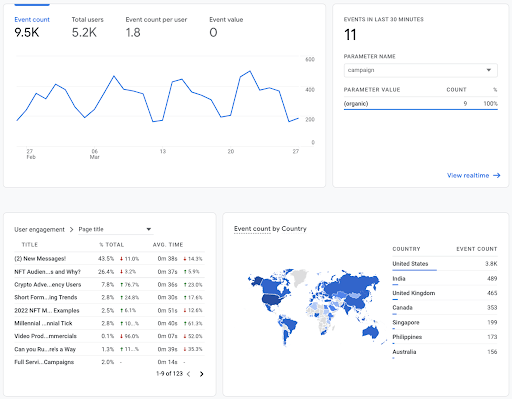
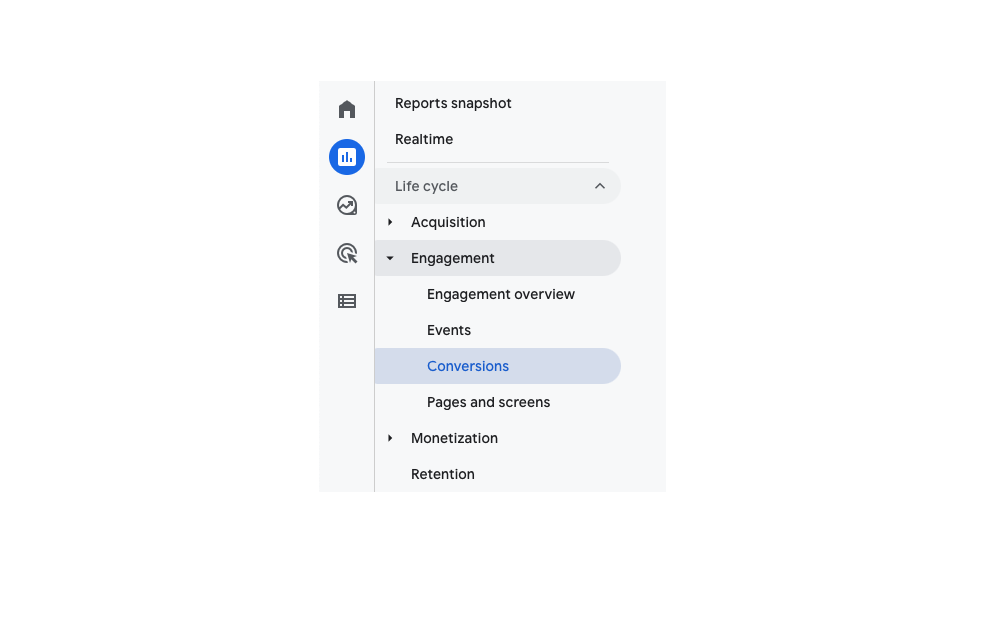
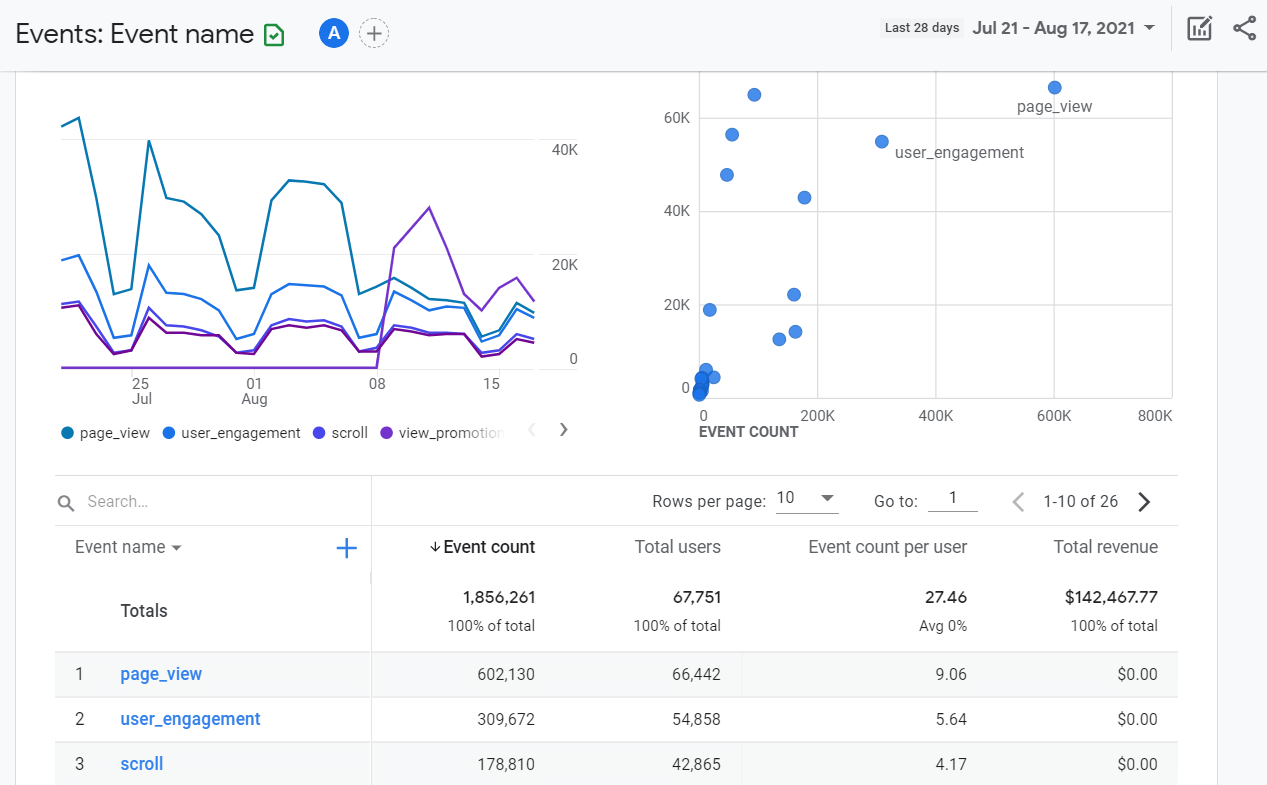
In GA4, you can find event metrics in the Life cycle -> Engagement -> Events report. It will show you all automatically collected events.
In the above example, you will notice an event count throughout the time as a line graph, events that occurred in the last 30 minutes, user engagement data per page, and event count by country.
4. Conversions
Conversions measure users’ activities contributing to your business objectives. For instance, a user fills up the form, downloads a file, or talks with a chatbot.
Presently, GA4 automatically tracks five pre-defined conversions, including:
- purchase (web and app)
- first_open (app only)
- in_app_purchase (app only)
- app_store_subscription_convert (app only)
- app_store_subscription_renew (app only)
The problem is most of the auto-tracked conversions are for apps only. Fortunately, Google Analytics 4 lets you mark any event as a conversion.
For instance, you can mark the event “file_download” as a conversion. It’s the simplest way to set conversions (your goals) for tracked events.
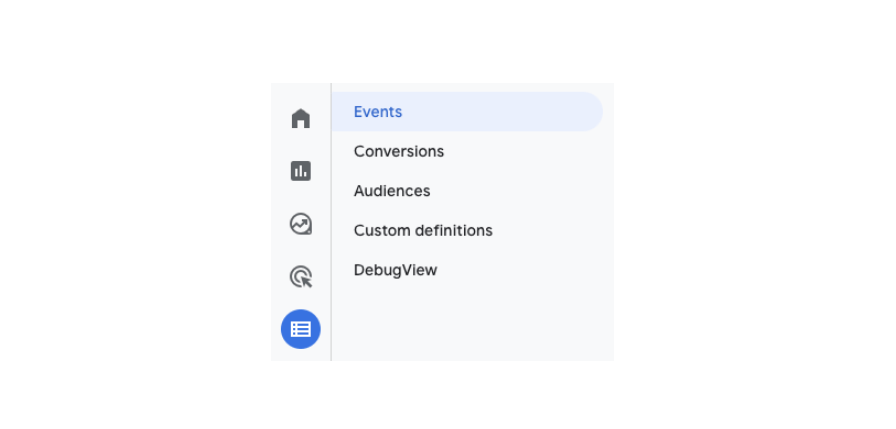
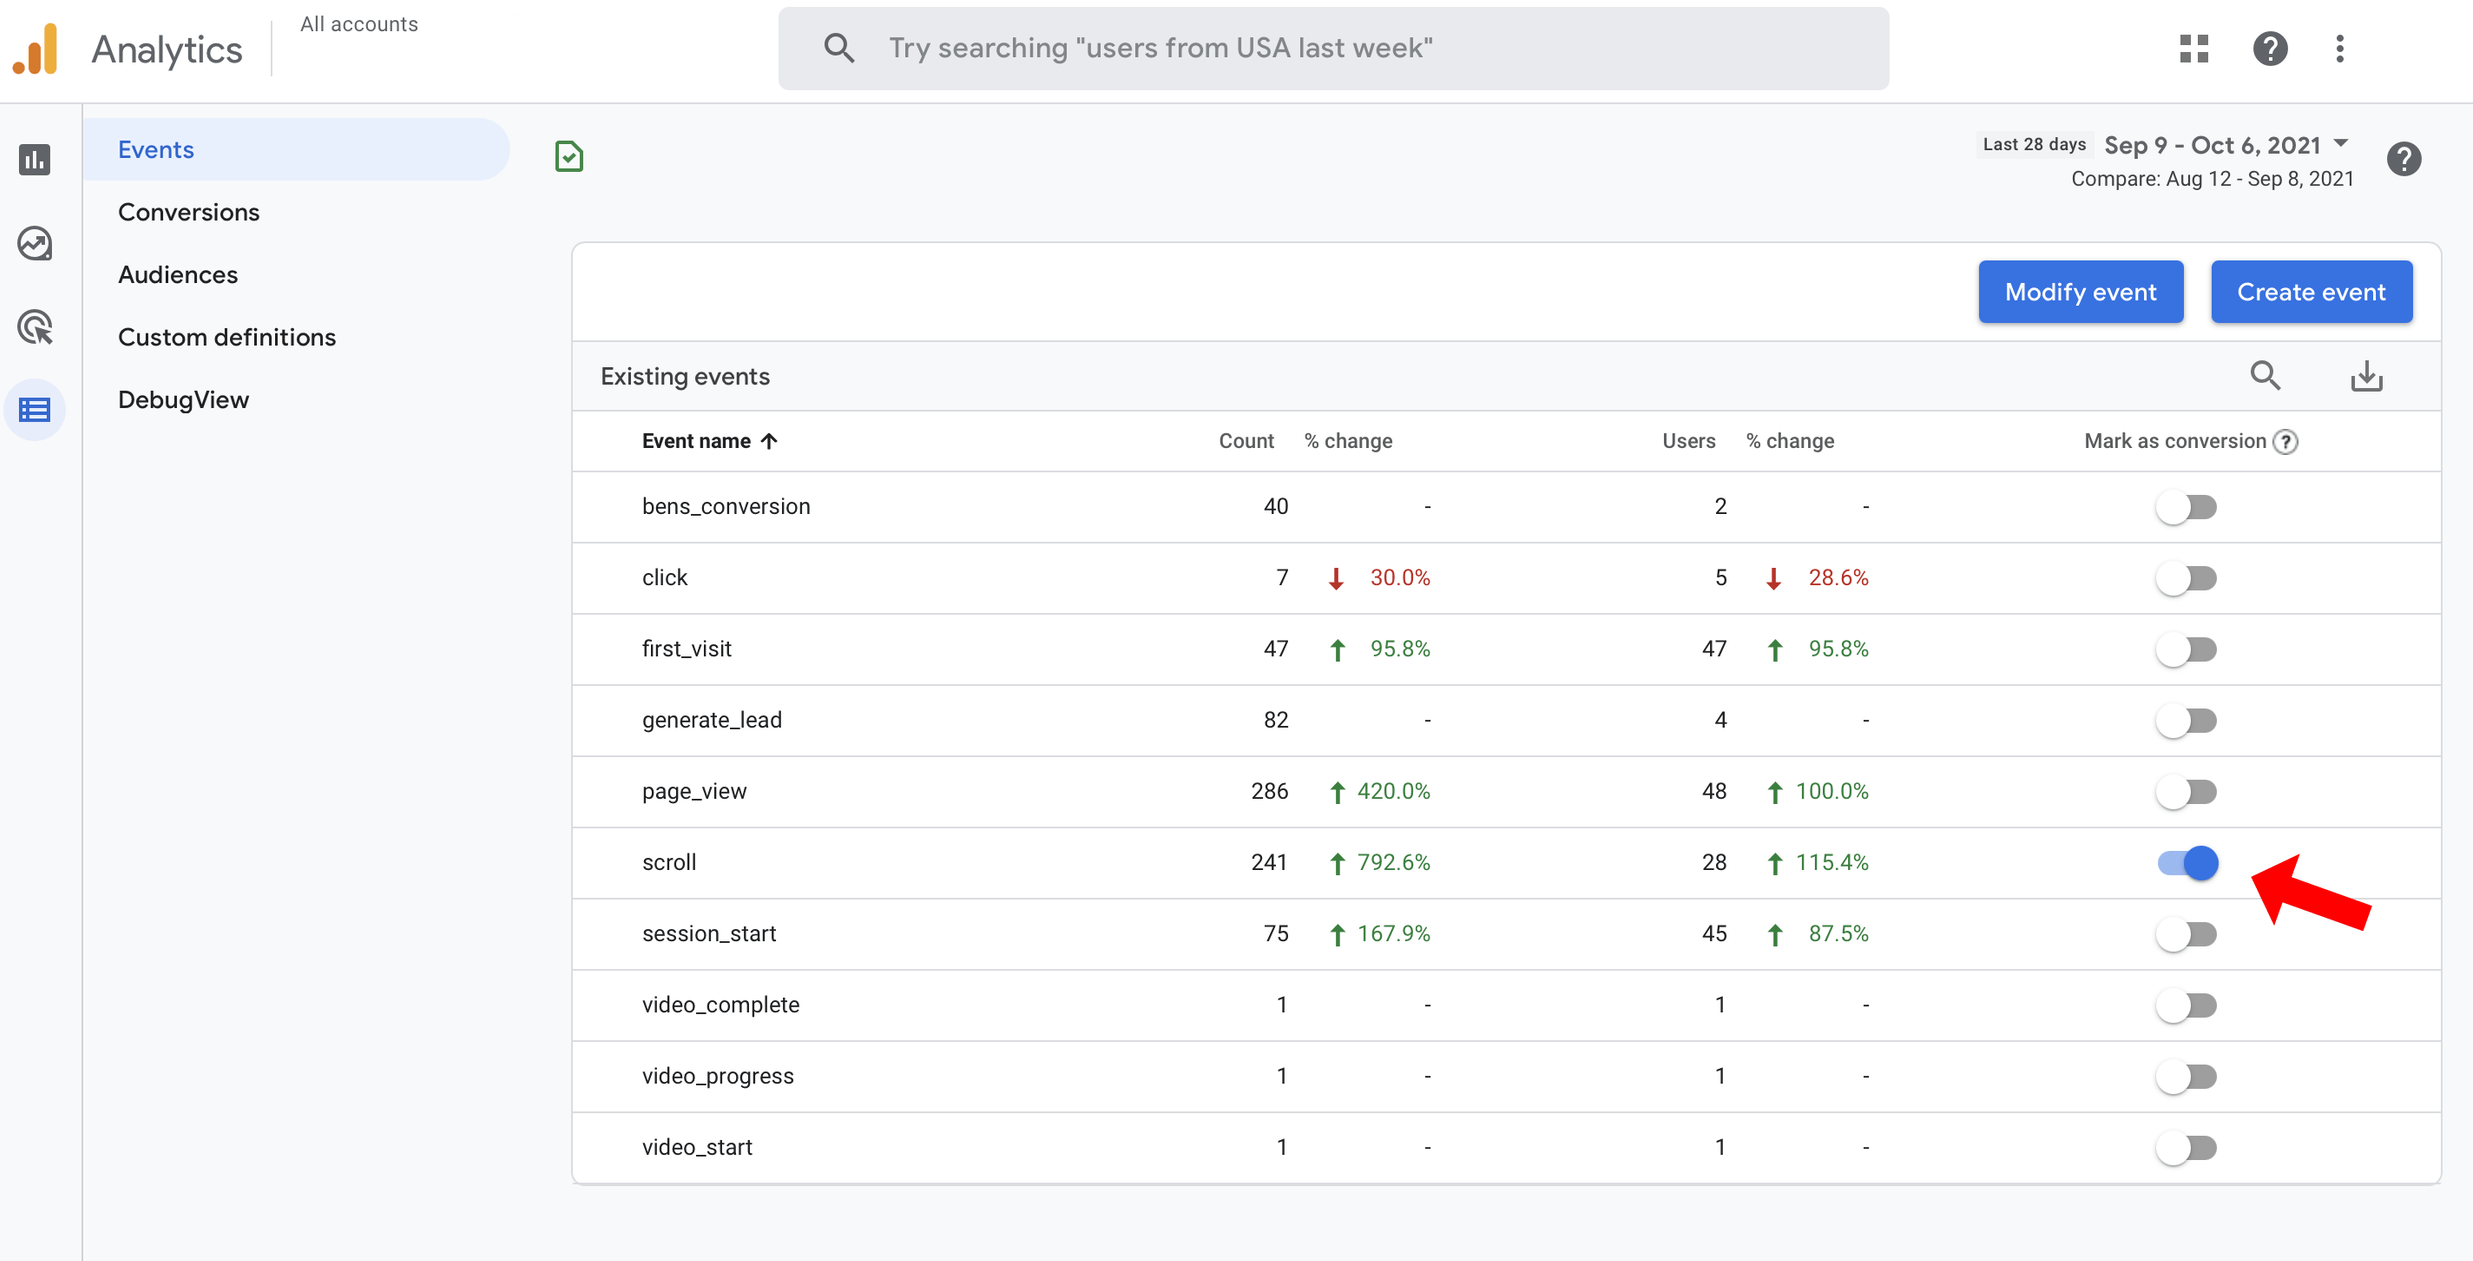
To turn an event into a conversion, navigate to Configure -> Events.
Locate the existing event you want to convert and click the toggle on your right to mark it as a conversion.
Note: As per GA4, you can mark a maximum of 30 additional conversion events. So, it would be best if you chose only the most important events to track as conversions.
In Google Analytics 4, you can find Conversions in Life cycle -> Engagement -> Conversions report.
Here you will see all automatically collected events and events you marked as conversions.
To analyse conversion events in-depth, click on the blue event name to view conversions based on marketing channels or pages. In this case, we will click “file_download” and select “Page path and screen class” to see which marketing channels bring the user and which pages receive maximum conversions.
Arguably, this is the most crucial report as it unveils whether or not your marketing efforts are meeting your business goals.
Conclusion
Google Analytics 4 has set the date to discontinue Universal Analytics on July 1, 2023. Now is the time to get familiar with GA4, educate your team, and create measurement strategies.
Once you make it through the learning curve, you’ll be able to leverage GA4’s flexibility and enhanced insights to predict user behaviour while taking care of user privacy. You’ll find GA4 as the most powerful analytics tool you have always been waiting for.
All you need is a basic setup, twenty minutes of daily learning, and the ability to pull a handful of strategic reports to move toward success.
Remember, better analytics data = better marketing decisions.
In search for strategic sessions?
Let us understand your business thoroughly and help you
strategies your digital product.
It's time to call your business-
a brand!
Australian Owned Agency
Save Time and Money
Unbeatable Value
Where Work Gets Done

free Ecommerce SEO guide for Higher Sales & Conversion


THE ULTIMATE MARKETING GUIDE FOR LAWYERS


Youtube Ads Guide How to Advertise on Youtube


free Ecommerce SEO guide for Higher Sales & Conversion


It's time to call your business-
a brand!
Australian Owned Agency
Save Time and Money
Unbeatable Value
Where Work Gets Done


The Game-Changing Ecommerce SEO Guide That Will Blow Your Mind & Sales
With this Ecommerce SEO Guide, you'll be able to:
- Develop a Ecommerce SEO strategy.
- Build a content marketing strategy that aligns with your business goals.
- Convert your website visitors into paying customers.


Youtube ads guide how to advertise on youtube
With this Youtube ads Guide, you'll be able to:
- Develop a Youtube ads strategy.
- Build a type of ads of your own that aligns with your business goals.
- Generate revenue from youtube ads.
It's time to call your business-
a brand!
Australian Owned Agency
Save Time and Money
Unbeatable Value
Where Work Gets Done









 Australian Owned Agency
 Save Time and Money
 Unbeatable Value
 Where Work Gets Done